Hispanic or Latino vs Iranian Seniors Poverty Over the Age of 65
COMPARE
Hispanic or Latino
Iranian
Seniors Poverty Over the Age of 65
Seniors Poverty Over the Age of 65 Comparison
Hispanics or Latinos
Iranians
14.3%
SENIORS POVERTY OVER THE AGE OF 65
0.0/ 100
METRIC RATING
312th/ 347
METRIC RANK
9.8%
SENIORS POVERTY OVER THE AGE OF 65
98.9/ 100
METRIC RATING
61st/ 347
METRIC RANK
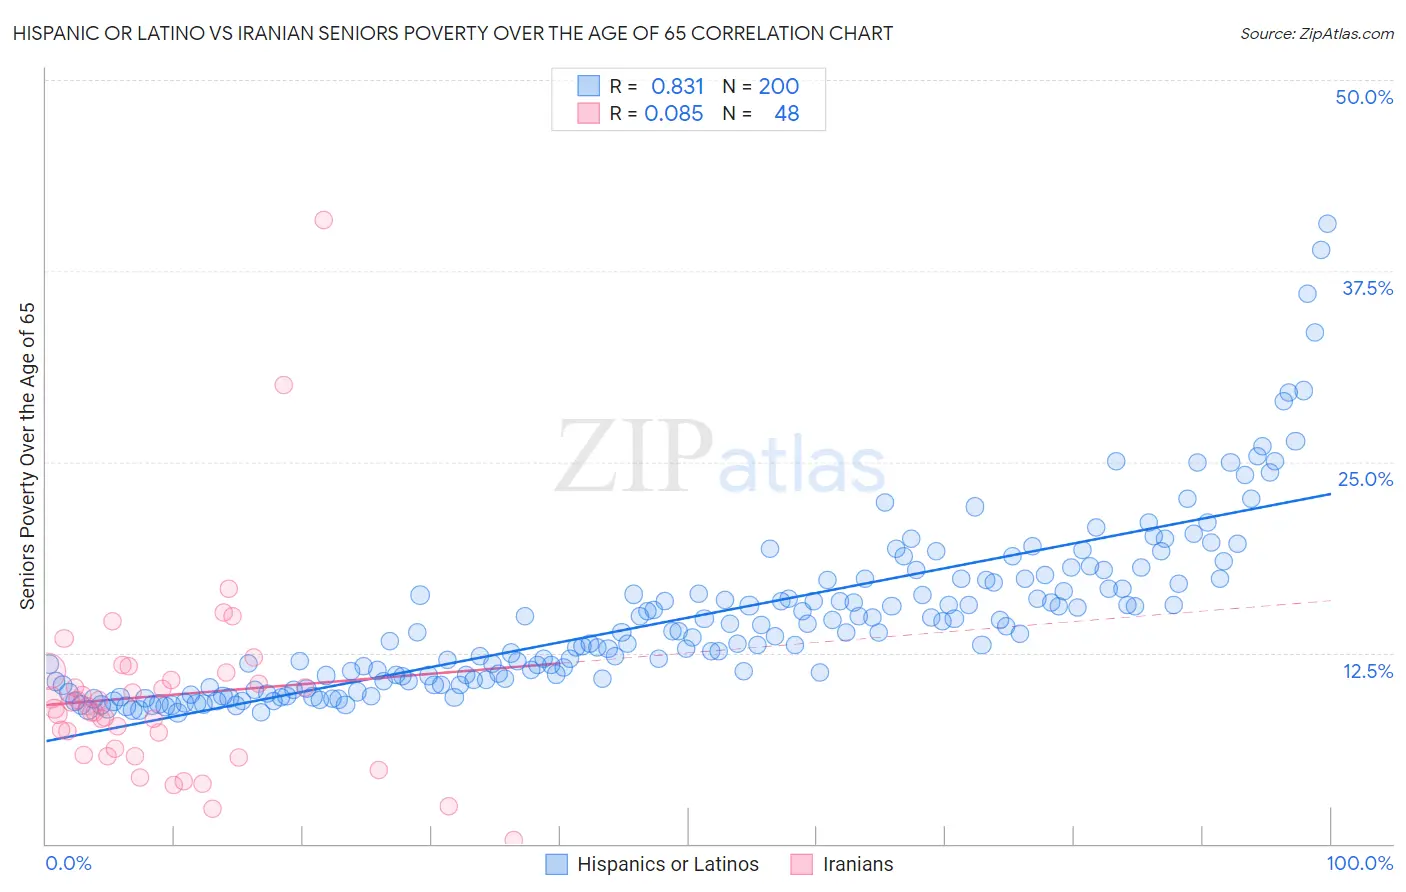
Hispanic or Latino vs Iranian Seniors Poverty Over the Age of 65 Correlation Chart
The statistical analysis conducted on geographies consisting of 572,245,774 people shows a very strong positive correlation between the proportion of Hispanics or Latinos and poverty level among seniors over the age of 65 in the United States with a correlation coefficient (R) of 0.831 and weighted average of 14.3%. Similarly, the statistical analysis conducted on geographies consisting of 315,982,705 people shows a slight positive correlation between the proportion of Iranians and poverty level among seniors over the age of 65 in the United States with a correlation coefficient (R) of 0.085 and weighted average of 9.8%, a difference of 45.6%.
Seniors Poverty Over the Age of 65 Correlation Summary
| Measurement | Hispanic or Latino | Iranian |
| Minimum | 8.6% | 0.21% |
| Maximum | 40.6% | 40.9% |
| Range | 32.0% | 40.7% |
| Mean | 14.8% | 9.7% |
| Median | 13.8% | 8.9% |
| Interquartile 25% (IQ1) | 10.7% | 6.0% |
| Interquartile 75% (IQ3) | 17.2% | 10.9% |
| Interquartile Range (IQR) | 6.5% | 5.0% |
| Standard Deviation (Sample) | 5.6% | 6.5% |
| Standard Deviation (Population) | 5.6% | 6.5% |
Similar Demographics by Seniors Poverty Over the Age of 65
Demographics Similar to Hispanics or Latinos by Seniors Poverty Over the Age of 65
In terms of seniors poverty over the age of 65, the demographic groups most similar to Hispanics or Latinos are Barbadian (14.4%, a difference of 0.37%), Bahamian (14.2%, a difference of 0.54%), Native/Alaskan (14.2%, a difference of 0.54%), Guyanese (14.4%, a difference of 0.77%), and Honduran (14.2%, a difference of 0.80%).
| Demographics | Rating | Rank | Seniors Poverty Over the Age of 65 |
| Immigrants | Trinidad and Tobago | 0.0 /100 | #305 | Tragic 14.1% |
| Immigrants | Latin America | 0.0 /100 | #306 | Tragic 14.2% |
| Immigrants | West Indies | 0.0 /100 | #307 | Tragic 14.2% |
| Trinidadians and Tobagonians | 0.0 /100 | #308 | Tragic 14.2% |
| Hondurans | 0.0 /100 | #309 | Tragic 14.2% |
| Bahamians | 0.0 /100 | #310 | Tragic 14.2% |
| Natives/Alaskans | 0.0 /100 | #311 | Tragic 14.2% |
| Hispanics or Latinos | 0.0 /100 | #312 | Tragic 14.3% |
| Barbadians | 0.0 /100 | #313 | Tragic 14.4% |
| Guyanese | 0.0 /100 | #314 | Tragic 14.4% |
| Immigrants | Ecuador | 0.0 /100 | #315 | Tragic 14.4% |
| Immigrants | Guyana | 0.0 /100 | #316 | Tragic 14.5% |
| Haitians | 0.0 /100 | #317 | Tragic 14.5% |
| Immigrants | Honduras | 0.0 /100 | #318 | Tragic 14.5% |
| Cape Verdeans | 0.0 /100 | #319 | Tragic 14.7% |
Demographics Similar to Iranians by Seniors Poverty Over the Age of 65
In terms of seniors poverty over the age of 65, the demographic groups most similar to Iranians are French Canadian (9.8%, a difference of 0.040%), Celtic (9.8%, a difference of 0.080%), Immigrants from Canada (9.8%, a difference of 0.11%), Macedonian (9.9%, a difference of 0.22%), and Serbian (9.8%, a difference of 0.27%).
| Demographics | Rating | Rank | Seniors Poverty Over the Age of 65 |
| Immigrants | Northern Europe | 99.2 /100 | #54 | Exceptional 9.8% |
| Afghans | 99.2 /100 | #55 | Exceptional 9.8% |
| Immigrants | England | 99.1 /100 | #56 | Exceptional 9.8% |
| Bolivians | 99.1 /100 | #57 | Exceptional 9.8% |
| Serbians | 99.1 /100 | #58 | Exceptional 9.8% |
| Immigrants | Canada | 99.0 /100 | #59 | Exceptional 9.8% |
| Celtics | 99.0 /100 | #60 | Exceptional 9.8% |
| Iranians | 98.9 /100 | #61 | Exceptional 9.8% |
| French Canadians | 98.9 /100 | #62 | Exceptional 9.8% |
| Macedonians | 98.8 /100 | #63 | Exceptional 9.9% |
| Immigrants | North America | 98.8 /100 | #64 | Exceptional 9.9% |
| Pennsylvania Germans | 98.7 /100 | #65 | Exceptional 9.9% |
| Immigrants | Netherlands | 98.7 /100 | #66 | Exceptional 9.9% |
| Immigrants | Austria | 98.6 /100 | #67 | Exceptional 9.9% |
| Canadians | 98.5 /100 | #68 | Exceptional 9.9% |