Hispanic or Latino vs Uruguayan Seniors Poverty Over the Age of 65
COMPARE
Hispanic or Latino
Uruguayan
Seniors Poverty Over the Age of 65
Seniors Poverty Over the Age of 65 Comparison
Hispanics or Latinos
Uruguayans
14.3%
SENIORS POVERTY OVER THE AGE OF 65
0.0/ 100
METRIC RATING
312th/ 347
METRIC RANK
12.1%
SENIORS POVERTY OVER THE AGE OF 65
0.8/ 100
METRIC RATING
243rd/ 347
METRIC RANK
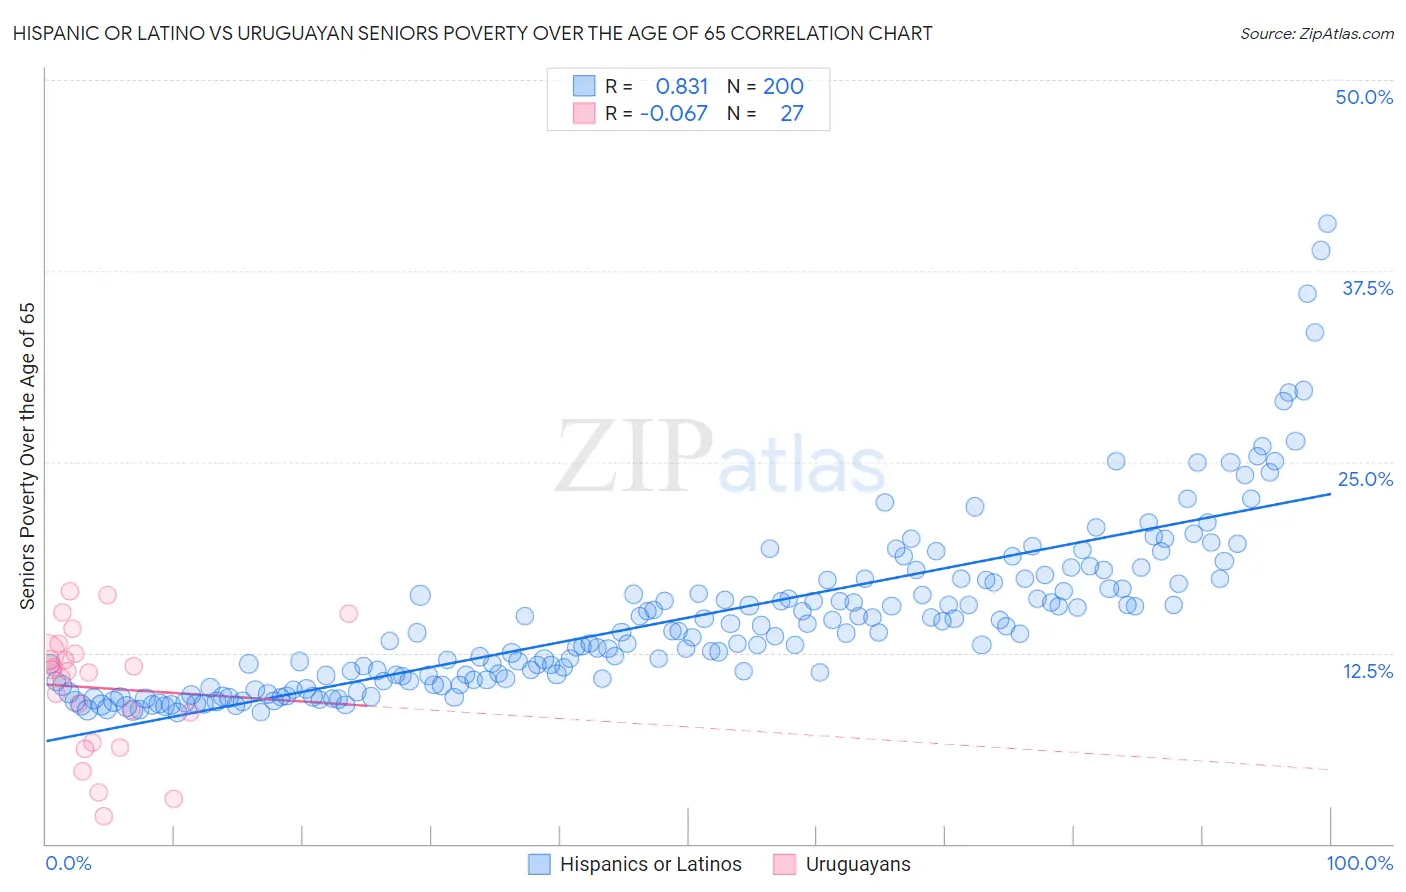
Hispanic or Latino vs Uruguayan Seniors Poverty Over the Age of 65 Correlation Chart
The statistical analysis conducted on geographies consisting of 572,245,774 people shows a very strong positive correlation between the proportion of Hispanics or Latinos and poverty level among seniors over the age of 65 in the United States with a correlation coefficient (R) of 0.831 and weighted average of 14.3%. Similarly, the statistical analysis conducted on geographies consisting of 144,646,384 people shows a slight negative correlation between the proportion of Uruguayans and poverty level among seniors over the age of 65 in the United States with a correlation coefficient (R) of -0.067 and weighted average of 12.1%, a difference of 18.4%.
Seniors Poverty Over the Age of 65 Correlation Summary
| Measurement | Hispanic or Latino | Uruguayan |
| Minimum | 8.6% | 1.8% |
| Maximum | 40.6% | 16.5% |
| Range | 32.0% | 14.7% |
| Mean | 14.8% | 10.2% |
| Median | 13.8% | 11.3% |
| Interquartile 25% (IQ1) | 10.7% | 6.7% |
| Interquartile 75% (IQ3) | 17.2% | 12.5% |
| Interquartile Range (IQR) | 6.5% | 5.9% |
| Standard Deviation (Sample) | 5.6% | 4.0% |
| Standard Deviation (Population) | 5.6% | 4.0% |
Similar Demographics by Seniors Poverty Over the Age of 65
Demographics Similar to Hispanics or Latinos by Seniors Poverty Over the Age of 65
In terms of seniors poverty over the age of 65, the demographic groups most similar to Hispanics or Latinos are Barbadian (14.4%, a difference of 0.37%), Bahamian (14.2%, a difference of 0.54%), Native/Alaskan (14.2%, a difference of 0.54%), Guyanese (14.4%, a difference of 0.77%), and Honduran (14.2%, a difference of 0.80%).
| Demographics | Rating | Rank | Seniors Poverty Over the Age of 65 |
| Immigrants | Trinidad and Tobago | 0.0 /100 | #305 | Tragic 14.1% |
| Immigrants | Latin America | 0.0 /100 | #306 | Tragic 14.2% |
| Immigrants | West Indies | 0.0 /100 | #307 | Tragic 14.2% |
| Trinidadians and Tobagonians | 0.0 /100 | #308 | Tragic 14.2% |
| Hondurans | 0.0 /100 | #309 | Tragic 14.2% |
| Bahamians | 0.0 /100 | #310 | Tragic 14.2% |
| Natives/Alaskans | 0.0 /100 | #311 | Tragic 14.2% |
| Hispanics or Latinos | 0.0 /100 | #312 | Tragic 14.3% |
| Barbadians | 0.0 /100 | #313 | Tragic 14.4% |
| Guyanese | 0.0 /100 | #314 | Tragic 14.4% |
| Immigrants | Ecuador | 0.0 /100 | #315 | Tragic 14.4% |
| Immigrants | Guyana | 0.0 /100 | #316 | Tragic 14.5% |
| Haitians | 0.0 /100 | #317 | Tragic 14.5% |
| Immigrants | Honduras | 0.0 /100 | #318 | Tragic 14.5% |
| Cape Verdeans | 0.0 /100 | #319 | Tragic 14.7% |
Demographics Similar to Uruguayans by Seniors Poverty Over the Age of 65
In terms of seniors poverty over the age of 65, the demographic groups most similar to Uruguayans are Subsaharan African (12.1%, a difference of 0.12%), Immigrants from Albania (12.1%, a difference of 0.16%), Comanche (12.1%, a difference of 0.18%), Immigrants from Portugal (12.1%, a difference of 0.22%), and Immigrants from Spain (12.1%, a difference of 0.29%).
| Demographics | Rating | Rank | Seniors Poverty Over the Age of 65 |
| Immigrants | Peru | 1.3 /100 | #236 | Tragic 12.0% |
| Moroccans | 1.2 /100 | #237 | Tragic 12.0% |
| Seminole | 1.1 /100 | #238 | Tragic 12.0% |
| Immigrants | Spain | 1.0 /100 | #239 | Tragic 12.1% |
| Comanche | 0.9 /100 | #240 | Tragic 12.1% |
| Immigrants | Albania | 0.9 /100 | #241 | Tragic 12.1% |
| Sub-Saharan Africans | 0.9 /100 | #242 | Tragic 12.1% |
| Uruguayans | 0.8 /100 | #243 | Tragic 12.1% |
| Immigrants | Portugal | 0.8 /100 | #244 | Tragic 12.1% |
| Chippewa | 0.7 /100 | #245 | Tragic 12.1% |
| Cree | 0.7 /100 | #246 | Tragic 12.1% |
| Japanese | 0.6 /100 | #247 | Tragic 12.2% |
| Spanish Americans | 0.6 /100 | #248 | Tragic 12.2% |
| Ute | 0.6 /100 | #249 | Tragic 12.2% |
| Immigrants | Liberia | 0.5 /100 | #250 | Tragic 12.2% |