Hawaiian vs Maltese Single Male Poverty
COMPARE
Hawaiian
Maltese
Single Male Poverty
Single Male Poverty Comparison
Hawaiians
Maltese
12.6%
SINGLE MALE POVERTY
75.1/ 100
METRIC RATING
144th/ 347
METRIC RANK
11.3%
SINGLE MALE POVERTY
100.0/ 100
METRIC RATING
25th/ 347
METRIC RANK
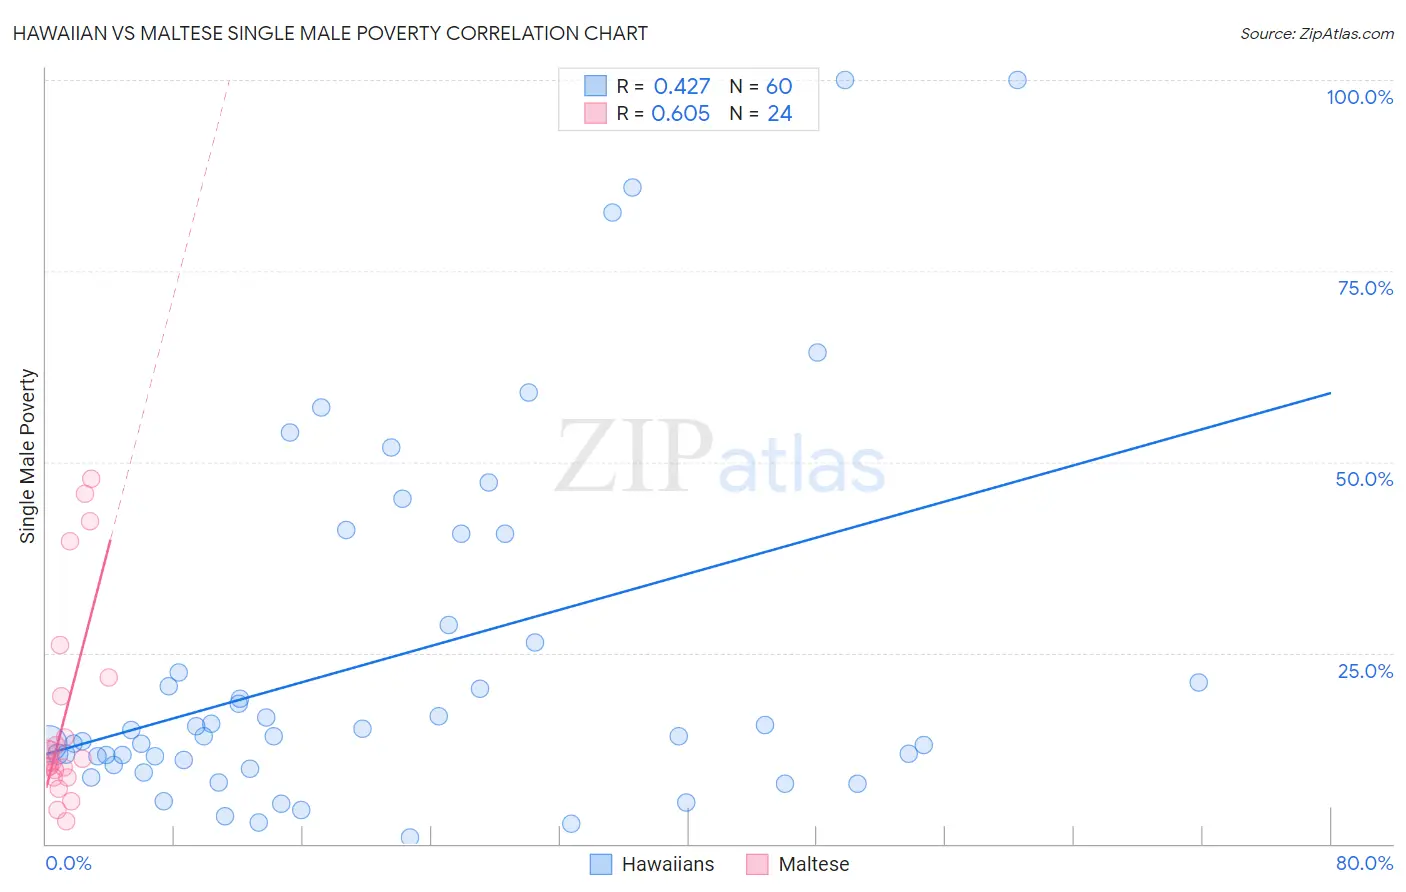
Hawaiian vs Maltese Single Male Poverty Correlation Chart
The statistical analysis conducted on geographies consisting of 300,272,441 people shows a moderate positive correlation between the proportion of Hawaiians and poverty level among single males in the United States with a correlation coefficient (R) of 0.427 and weighted average of 12.6%. Similarly, the statistical analysis conducted on geographies consisting of 117,992,298 people shows a significant positive correlation between the proportion of Maltese and poverty level among single males in the United States with a correlation coefficient (R) of 0.605 and weighted average of 11.3%, a difference of 12.0%.
Single Male Poverty Correlation Summary
| Measurement | Hawaiian | Maltese |
| Minimum | 0.75% | 3.0% |
| Maximum | 100.0% | 47.8% |
| Range | 99.3% | 44.8% |
| Mean | 24.1% | 16.8% |
| Median | 14.1% | 10.9% |
| Interquartile 25% (IQ1) | 10.7% | 9.2% |
| Interquartile 75% (IQ3) | 27.4% | 20.5% |
| Interquartile Range (IQR) | 16.7% | 11.3% |
| Standard Deviation (Sample) | 24.0% | 13.4% |
| Standard Deviation (Population) | 23.8% | 13.1% |
Similar Demographics by Single Male Poverty
Demographics Similar to Hawaiians by Single Male Poverty
In terms of single male poverty, the demographic groups most similar to Hawaiians are Immigrants from Lebanon (12.6%, a difference of 0.010%), Native Hawaiian (12.6%, a difference of 0.010%), Malaysian (12.6%, a difference of 0.020%), Immigrants from France (12.6%, a difference of 0.050%), and Okinawan (12.6%, a difference of 0.060%).
| Demographics | Rating | Rank | Single Male Poverty |
| Ukrainians | 80.7 /100 | #137 | Excellent 12.6% |
| Immigrants | El Salvador | 80.0 /100 | #138 | Excellent 12.6% |
| Cubans | 79.9 /100 | #139 | Good 12.6% |
| Immigrants | Zimbabwe | 78.0 /100 | #140 | Good 12.6% |
| Okinawans | 75.9 /100 | #141 | Good 12.6% |
| Immigrants | Uganda | 75.9 /100 | #142 | Good 12.6% |
| Immigrants | France | 75.8 /100 | #143 | Good 12.6% |
| Hawaiians | 75.1 /100 | #144 | Good 12.6% |
| Immigrants | Lebanon | 75.0 /100 | #145 | Good 12.6% |
| Native Hawaiians | 75.0 /100 | #146 | Good 12.6% |
| Malaysians | 74.8 /100 | #147 | Good 12.6% |
| Yugoslavians | 73.9 /100 | #148 | Good 12.6% |
| Sierra Leoneans | 73.0 /100 | #149 | Good 12.6% |
| Immigrants | Panama | 72.1 /100 | #150 | Good 12.6% |
| Immigrants | Hungary | 71.9 /100 | #151 | Good 12.6% |
Demographics Similar to Maltese by Single Male Poverty
In terms of single male poverty, the demographic groups most similar to Maltese are Indian (Asian) (11.3%, a difference of 0.020%), Bolivian (11.2%, a difference of 0.22%), Immigrants from Japan (11.3%, a difference of 0.33%), Immigrants from Pakistan (11.2%, a difference of 0.43%), and Asian (11.2%, a difference of 0.52%).
| Demographics | Rating | Rank | Single Male Poverty |
| Immigrants | Bolivia | 100.0 /100 | #18 | Exceptional 11.1% |
| Immigrants | Moldova | 100.0 /100 | #19 | Exceptional 11.2% |
| Ethiopians | 100.0 /100 | #20 | Exceptional 11.2% |
| Asians | 100.0 /100 | #21 | Exceptional 11.2% |
| Immigrants | Pakistan | 100.0 /100 | #22 | Exceptional 11.2% |
| Bolivians | 100.0 /100 | #23 | Exceptional 11.2% |
| Indians (Asian) | 100.0 /100 | #24 | Exceptional 11.3% |
| Maltese | 100.0 /100 | #25 | Exceptional 11.3% |
| Immigrants | Japan | 100.0 /100 | #26 | Exceptional 11.3% |
| Immigrants | China | 100.0 /100 | #27 | Exceptional 11.4% |
| Immigrants | Asia | 100.0 /100 | #28 | Exceptional 11.4% |
| Immigrants | Egypt | 100.0 /100 | #29 | Exceptional 11.4% |
| Iranians | 100.0 /100 | #30 | Exceptional 11.4% |
| Immigrants | Iran | 100.0 /100 | #31 | Exceptional 11.4% |
| Immigrants | Eastern Asia | 100.0 /100 | #32 | Exceptional 11.4% |