Haitian vs Dutch West Indian Receiving Food Stamps
COMPARE
Haitian
Dutch West Indian
Receiving Food Stamps
Receiving Food Stamps Comparison
Haitians
Dutch West Indians
17.8%
RECEIVING FOOD STAMPS
0.0/ 100
METRIC RATING
323rd/ 347
METRIC RANK
14.3%
RECEIVING FOOD STAMPS
0.2/ 100
METRIC RATING
267th/ 347
METRIC RANK
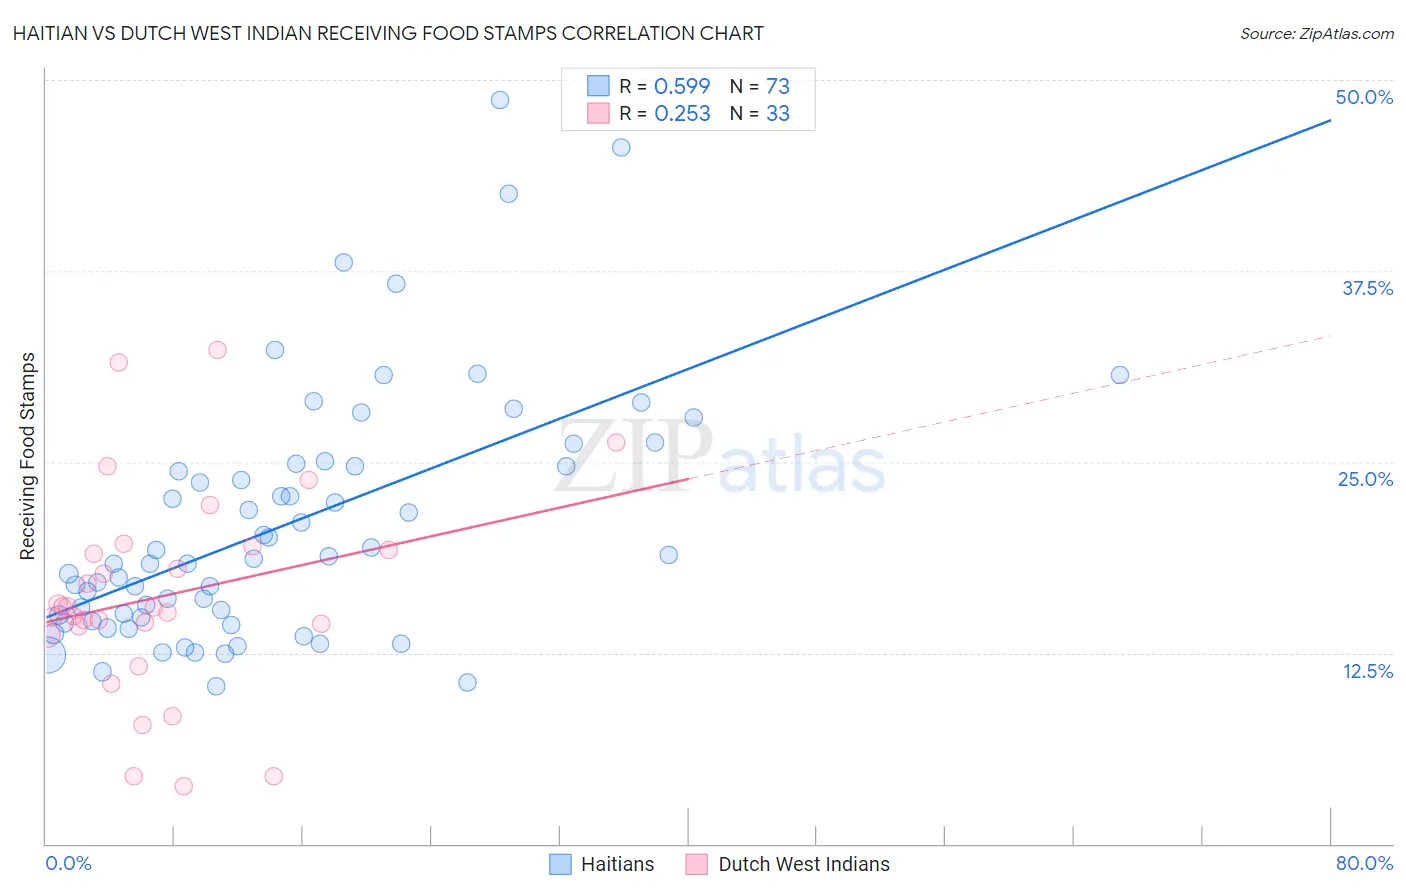
Haitian vs Dutch West Indian Receiving Food Stamps Correlation Chart
The statistical analysis conducted on geographies consisting of 287,415,058 people shows a substantial positive correlation between the proportion of Haitians and percentage of population receiving government assistance and/or food stamps in the United States with a correlation coefficient (R) of 0.599 and weighted average of 17.8%. Similarly, the statistical analysis conducted on geographies consisting of 85,754,540 people shows a weak positive correlation between the proportion of Dutch West Indians and percentage of population receiving government assistance and/or food stamps in the United States with a correlation coefficient (R) of 0.253 and weighted average of 14.3%, a difference of 24.1%.
Receiving Food Stamps Correlation Summary
| Measurement | Haitian | Dutch West Indian |
| Minimum | 10.3% | 3.8% |
| Maximum | 48.7% | 32.3% |
| Range | 38.4% | 28.5% |
| Mean | 20.9% | 16.2% |
| Median | 18.7% | 15.5% |
| Interquartile 25% (IQ1) | 14.7% | 14.0% |
| Interquartile 75% (IQ3) | 24.8% | 19.4% |
| Interquartile Range (IQR) | 10.1% | 5.4% |
| Standard Deviation (Sample) | 8.2% | 6.7% |
| Standard Deviation (Population) | 8.1% | 6.6% |
Similar Demographics by Receiving Food Stamps
Demographics Similar to Haitians by Receiving Food Stamps
In terms of receiving food stamps, the demographic groups most similar to Haitians are Immigrants from Grenada (17.8%, a difference of 0.010%), British West Indian (17.9%, a difference of 0.59%), Immigrants from Haiti (18.2%, a difference of 2.4%), Cuban (18.2%, a difference of 2.5%), and Apache (18.3%, a difference of 2.8%).
| Demographics | Rating | Rank | Receiving Food Stamps |
| Central American Indians | 0.0 /100 | #316 | Tragic 17.1% |
| Blacks/African Americans | 0.0 /100 | #317 | Tragic 17.2% |
| Menominee | 0.0 /100 | #318 | Tragic 17.2% |
| Immigrants | St. Vincent and the Grenadines | 0.0 /100 | #319 | Tragic 17.2% |
| Immigrants | Nicaragua | 0.0 /100 | #320 | Tragic 17.2% |
| Natives/Alaskans | 0.0 /100 | #321 | Tragic 17.3% |
| Immigrants | Grenada | 0.0 /100 | #322 | Tragic 17.8% |
| Haitians | 0.0 /100 | #323 | Tragic 17.8% |
| British West Indians | 0.0 /100 | #324 | Tragic 17.9% |
| Immigrants | Haiti | 0.0 /100 | #325 | Tragic 18.2% |
| Cubans | 0.0 /100 | #326 | Tragic 18.2% |
| Apache | 0.0 /100 | #327 | Tragic 18.3% |
| Colville | 0.0 /100 | #328 | Tragic 18.3% |
| Immigrants | Dominica | 0.0 /100 | #329 | Tragic 18.4% |
| Pima | 0.0 /100 | #330 | Tragic 19.0% |
Demographics Similar to Dutch West Indians by Receiving Food Stamps
In terms of receiving food stamps, the demographic groups most similar to Dutch West Indians are Cheyenne (14.3%, a difference of 0.22%), Blackfeet (14.3%, a difference of 0.30%), Immigrants from Uzbekistan (14.3%, a difference of 0.36%), Paiute (14.3%, a difference of 0.45%), and Immigrants from Portugal (14.3%, a difference of 0.45%).
| Demographics | Rating | Rank | Receiving Food Stamps |
| Central Americans | 0.3 /100 | #260 | Tragic 14.1% |
| Immigrants | Congo | 0.3 /100 | #261 | Tragic 14.1% |
| Paiute | 0.2 /100 | #262 | Tragic 14.3% |
| Immigrants | Portugal | 0.2 /100 | #263 | Tragic 14.3% |
| Immigrants | Uzbekistan | 0.2 /100 | #264 | Tragic 14.3% |
| Blackfeet | 0.2 /100 | #265 | Tragic 14.3% |
| Cheyenne | 0.2 /100 | #266 | Tragic 14.3% |
| Dutch West Indians | 0.2 /100 | #267 | Tragic 14.3% |
| Guatemalans | 0.1 /100 | #268 | Tragic 14.4% |
| Nepalese | 0.1 /100 | #269 | Tragic 14.6% |
| Mexicans | 0.1 /100 | #270 | Tragic 14.6% |
| Immigrants | Guatemala | 0.1 /100 | #271 | Tragic 14.6% |
| Chippewa | 0.1 /100 | #272 | Tragic 14.7% |
| Alaskan Athabascans | 0.1 /100 | #273 | Tragic 14.7% |
| Immigrants | Western Africa | 0.1 /100 | #274 | Tragic 14.7% |