Haitian vs Immigrants from Belize Unemployment Among Women with Children Under 6 years
COMPARE
Haitian
Immigrants from Belize
Unemployment Among Women with Children Under 6 years
Unemployment Among Women with Children Under 6 years Comparison
Haitians
Immigrants from Belize
8.6%
UNEMPLOYMENT AMONG WOMEN WITH CHILDREN UNDER 6 YEARS
0.0/ 100
METRIC RATING
277th/ 347
METRIC RANK
8.6%
UNEMPLOYMENT AMONG WOMEN WITH CHILDREN UNDER 6 YEARS
0.0/ 100
METRIC RATING
280th/ 347
METRIC RANK
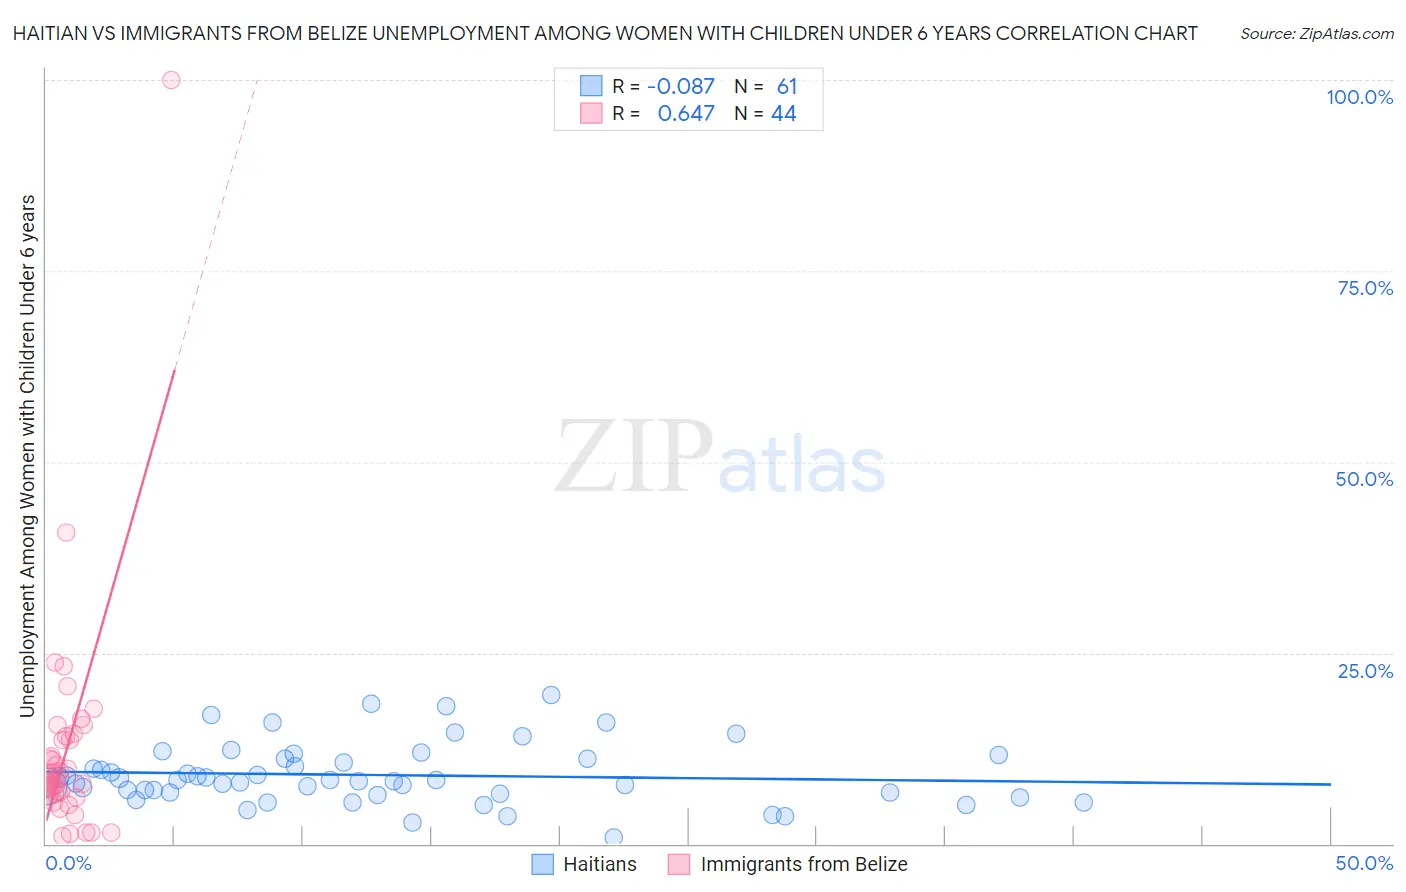
Haitian vs Immigrants from Belize Unemployment Among Women with Children Under 6 years Correlation Chart
The statistical analysis conducted on geographies consisting of 230,903,570 people shows a slight negative correlation between the proportion of Haitians and unemployment rate among women with children under the age of 6 in the United States with a correlation coefficient (R) of -0.087 and weighted average of 8.6%. Similarly, the statistical analysis conducted on geographies consisting of 116,794,257 people shows a significant positive correlation between the proportion of Immigrants from Belize and unemployment rate among women with children under the age of 6 in the United States with a correlation coefficient (R) of 0.647 and weighted average of 8.6%, a difference of 0.33%.
Unemployment Among Women with Children Under 6 years Correlation Summary
| Measurement | Haitian | Immigrants from Belize |
| Minimum | 0.90% | 1.0% |
| Maximum | 19.5% | 100.0% |
| Range | 18.6% | 99.0% |
| Mean | 9.0% | 12.3% |
| Median | 8.3% | 8.5% |
| Interquartile 25% (IQ1) | 6.6% | 6.6% |
| Interquartile 75% (IQ3) | 11.1% | 13.9% |
| Interquartile Range (IQR) | 4.6% | 7.3% |
| Standard Deviation (Sample) | 3.9% | 15.3% |
| Standard Deviation (Population) | 3.9% | 15.2% |
Demographics Similar to Haitians and Immigrants from Belize by Unemployment Among Women with Children Under 6 years
In terms of unemployment among women with children under 6 years, the demographic groups most similar to Haitians are Yaqui (8.6%, a difference of 0.10%), Immigrants from Dominica (8.6%, a difference of 0.28%), Immigrants from Guatemala (8.6%, a difference of 0.29%), Immigrants from Latin America (8.6%, a difference of 0.45%), and Guatemalan (8.7%, a difference of 0.46%). Similarly, the demographic groups most similar to Immigrants from Belize are Immigrants from Guatemala (8.6%, a difference of 0.040%), Immigrants from Dominica (8.6%, a difference of 0.050%), Guatemalan (8.7%, a difference of 0.14%), Bermudan (8.7%, a difference of 0.23%), and Spanish American Indian (8.7%, a difference of 0.25%).
| Demographics | Rating | Rank | Unemployment Among Women with Children Under 6 years |
| Sub-Saharan Africans | 0.2 /100 | #268 | Tragic 8.4% |
| Immigrants | Haiti | 0.2 /100 | #269 | Tragic 8.4% |
| Immigrants | Senegal | 0.2 /100 | #270 | Tragic 8.5% |
| Immigrants | Congo | 0.2 /100 | #271 | Tragic 8.5% |
| Mexican American Indians | 0.1 /100 | #272 | Tragic 8.5% |
| Slovaks | 0.1 /100 | #273 | Tragic 8.5% |
| Immigrants | Cameroon | 0.1 /100 | #274 | Tragic 8.6% |
| Immigrants | Latin America | 0.1 /100 | #275 | Tragic 8.6% |
| Yaqui | 0.0 /100 | #276 | Tragic 8.6% |
| Haitians | 0.0 /100 | #277 | Tragic 8.6% |
| Immigrants | Dominica | 0.0 /100 | #278 | Tragic 8.6% |
| Immigrants | Guatemala | 0.0 /100 | #279 | Tragic 8.6% |
| Immigrants | Belize | 0.0 /100 | #280 | Tragic 8.6% |
| Guatemalans | 0.0 /100 | #281 | Tragic 8.7% |
| Bermudans | 0.0 /100 | #282 | Tragic 8.7% |
| Spanish American Indians | 0.0 /100 | #283 | Tragic 8.7% |
| Blackfeet | 0.0 /100 | #284 | Tragic 8.7% |
| U.S. Virgin Islanders | 0.0 /100 | #285 | Tragic 8.7% |
| Seminole | 0.0 /100 | #286 | Tragic 8.7% |
| Menominee | 0.0 /100 | #287 | Tragic 8.7% |
| Bahamians | 0.0 /100 | #288 | Tragic 8.7% |