Guamanian/Chamorro vs Iranian Seniors Poverty Over the Age of 75
COMPARE
Guamanian/Chamorro
Iranian
Seniors Poverty Over the Age of 75
Seniors Poverty Over the Age of 75 Comparison
Guamanians/Chamorros
Iranians
11.6%
SENIORS POVERTY OVER THE AGE OF 75
90.6/ 100
METRIC RATING
102nd/ 347
METRIC RANK
11.5%
SENIORS POVERTY OVER THE AGE OF 75
95.1/ 100
METRIC RATING
82nd/ 347
METRIC RANK
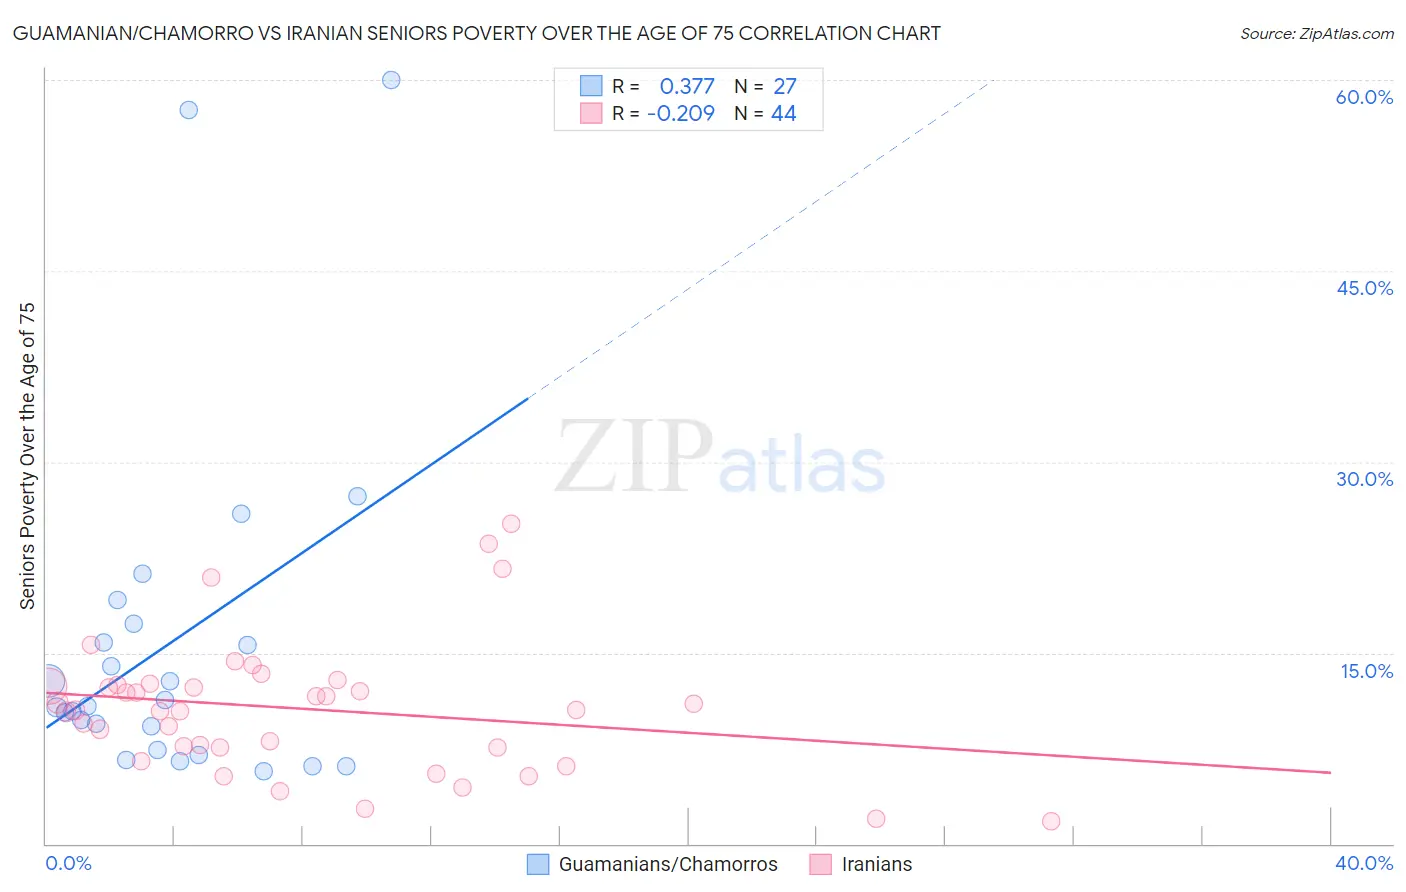
Guamanian/Chamorro vs Iranian Seniors Poverty Over the Age of 75 Correlation Chart
The statistical analysis conducted on geographies consisting of 220,212,550 people shows a mild positive correlation between the proportion of Guamanians/Chamorros and poverty level among seniors over the age of 75 in the United States with a correlation coefficient (R) of 0.377 and weighted average of 11.6%. Similarly, the statistical analysis conducted on geographies consisting of 314,002,652 people shows a weak negative correlation between the proportion of Iranians and poverty level among seniors over the age of 75 in the United States with a correlation coefficient (R) of -0.209 and weighted average of 11.5%, a difference of 1.5%.
Seniors Poverty Over the Age of 75 Correlation Summary
| Measurement | Guamanian/Chamorro | Iranian |
| Minimum | 5.7% | 1.7% |
| Maximum | 60.0% | 25.2% |
| Range | 54.3% | 23.4% |
| Mean | 15.8% | 10.6% |
| Median | 10.8% | 10.5% |
| Interquartile 25% (IQ1) | 7.4% | 7.6% |
| Interquartile 75% (IQ3) | 17.3% | 12.4% |
| Interquartile Range (IQR) | 9.9% | 4.8% |
| Standard Deviation (Sample) | 13.7% | 5.2% |
| Standard Deviation (Population) | 13.4% | 5.1% |
Demographics Similar to Guamanians/Chamorros and Iranians by Seniors Poverty Over the Age of 75
In terms of seniors poverty over the age of 75, the demographic groups most similar to Guamanians/Chamorros are Jordanian (11.6%, a difference of 0.040%), Syrian (11.6%, a difference of 0.12%), Immigrants from Ethiopia (11.6%, a difference of 0.28%), Immigrants from Japan (11.6%, a difference of 0.35%), and Romanian (11.6%, a difference of 0.46%). Similarly, the demographic groups most similar to Iranians are Immigrants from South Africa (11.5%, a difference of 0.080%), Immigrants from Iraq (11.5%, a difference of 0.090%), Immigrants from Bulgaria (11.5%, a difference of 0.19%), Australian (11.5%, a difference of 0.21%), and Korean (11.5%, a difference of 0.24%).
| Demographics | Rating | Rank | Seniors Poverty Over the Age of 75 |
| Iranians | 95.1 /100 | #82 | Exceptional 11.5% |
| Immigrants | South Africa | 94.9 /100 | #83 | Exceptional 11.5% |
| Immigrants | Iraq | 94.9 /100 | #84 | Exceptional 11.5% |
| Immigrants | Bulgaria | 94.7 /100 | #85 | Exceptional 11.5% |
| Australians | 94.6 /100 | #86 | Exceptional 11.5% |
| Koreans | 94.5 /100 | #87 | Exceptional 11.5% |
| Immigrants | Croatia | 94.5 /100 | #88 | Exceptional 11.5% |
| Immigrants | Sri Lanka | 94.4 /100 | #89 | Exceptional 11.5% |
| Aleuts | 94.1 /100 | #90 | Exceptional 11.5% |
| Immigrants | Germany | 94.1 /100 | #91 | Exceptional 11.5% |
| Kenyans | 93.9 /100 | #92 | Exceptional 11.5% |
| Immigrants | Poland | 92.9 /100 | #93 | Exceptional 11.6% |
| Creek | 92.7 /100 | #94 | Exceptional 11.6% |
| Immigrants | Bosnia and Herzegovina | 92.6 /100 | #95 | Exceptional 11.6% |
| Immigrants | Sweden | 92.6 /100 | #96 | Exceptional 11.6% |
| Romanians | 92.3 /100 | #97 | Exceptional 11.6% |
| Immigrants | Japan | 91.9 /100 | #98 | Exceptional 11.6% |
| Immigrants | Ethiopia | 91.7 /100 | #99 | Exceptional 11.6% |
| Syrians | 91.1 /100 | #100 | Exceptional 11.6% |
| Jordanians | 90.8 /100 | #101 | Exceptional 11.6% |
| Guamanians/Chamorros | 90.6 /100 | #102 | Exceptional 11.6% |