Guamanian/Chamorro vs Immigrants from St. Vincent and the Grenadines Seniors Poverty Over the Age of 75
COMPARE
Guamanian/Chamorro
Immigrants from St. Vincent and the Grenadines
Seniors Poverty Over the Age of 75
Seniors Poverty Over the Age of 75 Comparison
Guamanians/Chamorros
Immigrants from St. Vincent and the Grenadines
11.6%
SENIORS POVERTY OVER THE AGE OF 75
90.6/ 100
METRIC RATING
102nd/ 347
METRIC RANK
17.5%
SENIORS POVERTY OVER THE AGE OF 75
0.0/ 100
METRIC RATING
332nd/ 347
METRIC RANK
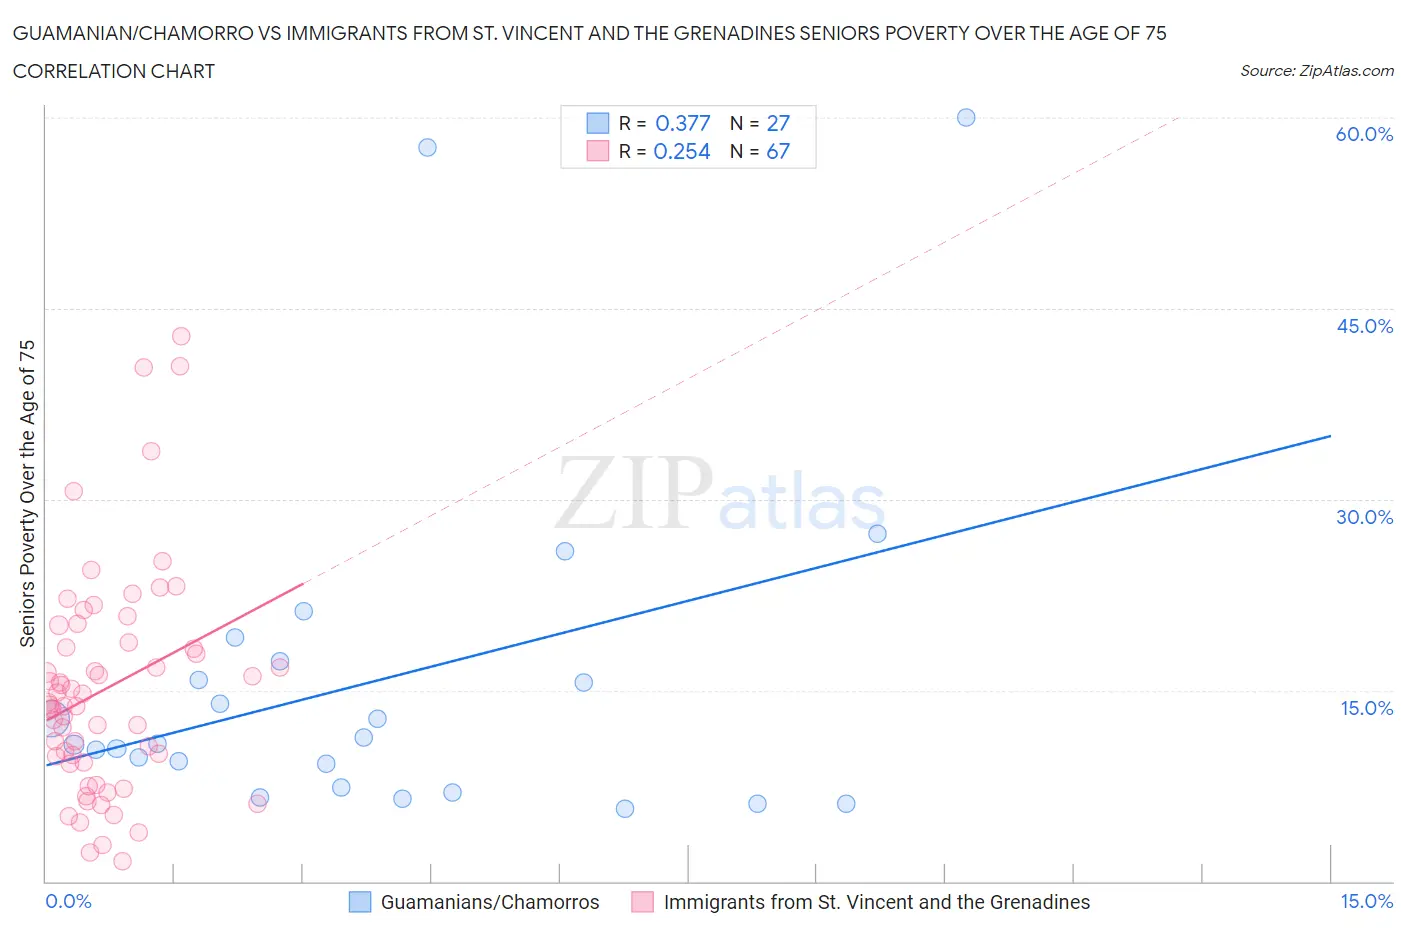
Guamanian/Chamorro vs Immigrants from St. Vincent and the Grenadines Seniors Poverty Over the Age of 75 Correlation Chart
The statistical analysis conducted on geographies consisting of 220,212,550 people shows a mild positive correlation between the proportion of Guamanians/Chamorros and poverty level among seniors over the age of 75 in the United States with a correlation coefficient (R) of 0.377 and weighted average of 11.6%. Similarly, the statistical analysis conducted on geographies consisting of 56,047,210 people shows a weak positive correlation between the proportion of Immigrants from St. Vincent and the Grenadines and poverty level among seniors over the age of 75 in the United States with a correlation coefficient (R) of 0.254 and weighted average of 17.5%, a difference of 50.5%.
Seniors Poverty Over the Age of 75 Correlation Summary
| Measurement | Guamanian/Chamorro | Immigrants from St. Vincent and the Grenadines |
| Minimum | 5.7% | 1.6% |
| Maximum | 60.0% | 42.8% |
| Range | 54.3% | 41.2% |
| Mean | 15.8% | 15.1% |
| Median | 10.8% | 13.9% |
| Interquartile 25% (IQ1) | 7.4% | 9.3% |
| Interquartile 75% (IQ3) | 17.3% | 18.8% |
| Interquartile Range (IQR) | 9.9% | 9.4% |
| Standard Deviation (Sample) | 13.7% | 8.7% |
| Standard Deviation (Population) | 13.4% | 8.7% |
Similar Demographics by Seniors Poverty Over the Age of 75
Demographics Similar to Guamanians/Chamorros by Seniors Poverty Over the Age of 75
In terms of seniors poverty over the age of 75, the demographic groups most similar to Guamanians/Chamorros are Jordanian (11.6%, a difference of 0.040%), Immigrants from Kuwait (11.6%, a difference of 0.040%), Immigrants from Singapore (11.6%, a difference of 0.090%), Chickasaw (11.6%, a difference of 0.10%), and Syrian (11.6%, a difference of 0.12%).
| Demographics | Rating | Rank | Seniors Poverty Over the Age of 75 |
| Immigrants | Bosnia and Herzegovina | 92.6 /100 | #95 | Exceptional 11.6% |
| Immigrants | Sweden | 92.6 /100 | #96 | Exceptional 11.6% |
| Romanians | 92.3 /100 | #97 | Exceptional 11.6% |
| Immigrants | Japan | 91.9 /100 | #98 | Exceptional 11.6% |
| Immigrants | Ethiopia | 91.7 /100 | #99 | Exceptional 11.6% |
| Syrians | 91.1 /100 | #100 | Exceptional 11.6% |
| Jordanians | 90.8 /100 | #101 | Exceptional 11.6% |
| Guamanians/Chamorros | 90.6 /100 | #102 | Exceptional 11.6% |
| Immigrants | Kuwait | 90.5 /100 | #103 | Exceptional 11.6% |
| Immigrants | Singapore | 90.3 /100 | #104 | Exceptional 11.6% |
| Chickasaw | 90.2 /100 | #105 | Exceptional 11.6% |
| Russians | 89.9 /100 | #106 | Excellent 11.6% |
| Immigrants | Oceania | 89.4 /100 | #107 | Excellent 11.7% |
| Turks | 89.4 /100 | #108 | Excellent 11.7% |
| South Africans | 89.3 /100 | #109 | Excellent 11.7% |
Demographics Similar to Immigrants from St. Vincent and the Grenadines by Seniors Poverty Over the Age of 75
In terms of seniors poverty over the age of 75, the demographic groups most similar to Immigrants from St. Vincent and the Grenadines are Immigrants from Armenia (17.5%, a difference of 0.26%), Immigrants from Nicaragua (17.6%, a difference of 0.47%), British West Indian (17.4%, a difference of 0.52%), Immigrants from Grenada (17.8%, a difference of 2.0%), and Cuban (18.0%, a difference of 2.6%).
| Demographics | Rating | Rank | Seniors Poverty Over the Age of 75 |
| Nicaraguans | 0.0 /100 | #325 | Tragic 16.6% |
| Pueblo | 0.0 /100 | #326 | Tragic 16.7% |
| Sioux | 0.0 /100 | #327 | Tragic 16.8% |
| Cape Verdeans | 0.0 /100 | #328 | Tragic 16.8% |
| Immigrants | Dominica | 0.0 /100 | #329 | Tragic 17.0% |
| British West Indians | 0.0 /100 | #330 | Tragic 17.4% |
| Immigrants | Armenia | 0.0 /100 | #331 | Tragic 17.5% |
| Immigrants | St. Vincent and the Grenadines | 0.0 /100 | #332 | Tragic 17.5% |
| Immigrants | Nicaragua | 0.0 /100 | #333 | Tragic 17.6% |
| Immigrants | Grenada | 0.0 /100 | #334 | Tragic 17.8% |
| Cubans | 0.0 /100 | #335 | Tragic 18.0% |
| Immigrants | Caribbean | 0.0 /100 | #336 | Tragic 18.2% |
| Yakama | 0.0 /100 | #337 | Tragic 18.3% |
| Immigrants | Cabo Verde | 0.0 /100 | #338 | Tragic 18.5% |
| Hopi | 0.0 /100 | #339 | Tragic 18.9% |