Syrian vs Iranian Seniors Poverty Over the Age of 75
COMPARE
Syrian
Iranian
Seniors Poverty Over the Age of 75
Seniors Poverty Over the Age of 75 Comparison
Syrians
Iranians
11.6%
SENIORS POVERTY OVER THE AGE OF 75
91.1/ 100
METRIC RATING
100th/ 347
METRIC RANK
11.5%
SENIORS POVERTY OVER THE AGE OF 75
95.1/ 100
METRIC RATING
82nd/ 347
METRIC RANK
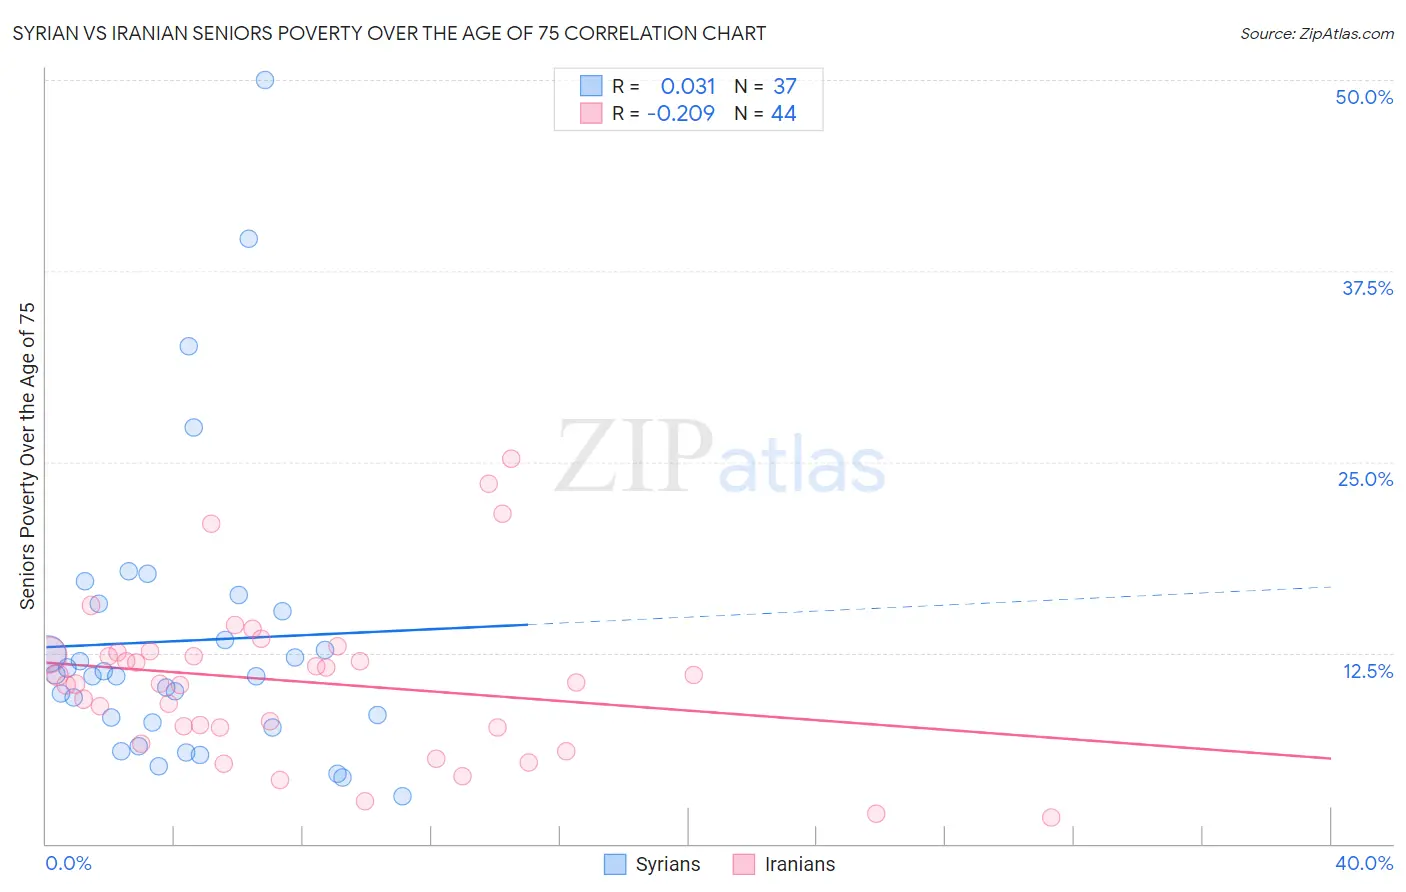
Syrian vs Iranian Seniors Poverty Over the Age of 75 Correlation Chart
The statistical analysis conducted on geographies consisting of 264,328,222 people shows no correlation between the proportion of Syrians and poverty level among seniors over the age of 75 in the United States with a correlation coefficient (R) of 0.031 and weighted average of 11.6%. Similarly, the statistical analysis conducted on geographies consisting of 314,002,652 people shows a weak negative correlation between the proportion of Iranians and poverty level among seniors over the age of 75 in the United States with a correlation coefficient (R) of -0.209 and weighted average of 11.5%, a difference of 1.4%.
Seniors Poverty Over the Age of 75 Correlation Summary
| Measurement | Syrian | Iranian |
| Minimum | 3.1% | 1.7% |
| Maximum | 50.0% | 25.2% |
| Range | 46.9% | 23.4% |
| Mean | 13.3% | 10.6% |
| Median | 11.0% | 10.5% |
| Interquartile 25% (IQ1) | 7.8% | 7.6% |
| Interquartile 75% (IQ3) | 15.5% | 12.4% |
| Interquartile Range (IQR) | 7.7% | 4.8% |
| Standard Deviation (Sample) | 9.7% | 5.2% |
| Standard Deviation (Population) | 9.6% | 5.1% |
Demographics Similar to Syrians and Iranians by Seniors Poverty Over the Age of 75
In terms of seniors poverty over the age of 75, the demographic groups most similar to Syrians are Jordanian (11.6%, a difference of 0.080%), Immigrants from Ethiopia (11.6%, a difference of 0.16%), Immigrants from Japan (11.6%, a difference of 0.23%), Romanian (11.6%, a difference of 0.34%), and Immigrants from Bosnia and Herzegovina (11.6%, a difference of 0.43%). Similarly, the demographic groups most similar to Iranians are Basque (11.5%, a difference of 0.010%), Immigrants from South Africa (11.5%, a difference of 0.080%), Immigrants from Iraq (11.5%, a difference of 0.090%), Immigrants from Bulgaria (11.5%, a difference of 0.19%), and Australian (11.5%, a difference of 0.21%).
| Demographics | Rating | Rank | Seniors Poverty Over the Age of 75 |
| Basques | 95.1 /100 | #81 | Exceptional 11.5% |
| Iranians | 95.1 /100 | #82 | Exceptional 11.5% |
| Immigrants | South Africa | 94.9 /100 | #83 | Exceptional 11.5% |
| Immigrants | Iraq | 94.9 /100 | #84 | Exceptional 11.5% |
| Immigrants | Bulgaria | 94.7 /100 | #85 | Exceptional 11.5% |
| Australians | 94.6 /100 | #86 | Exceptional 11.5% |
| Koreans | 94.5 /100 | #87 | Exceptional 11.5% |
| Immigrants | Croatia | 94.5 /100 | #88 | Exceptional 11.5% |
| Immigrants | Sri Lanka | 94.4 /100 | #89 | Exceptional 11.5% |
| Aleuts | 94.1 /100 | #90 | Exceptional 11.5% |
| Immigrants | Germany | 94.1 /100 | #91 | Exceptional 11.5% |
| Kenyans | 93.9 /100 | #92 | Exceptional 11.5% |
| Immigrants | Poland | 92.9 /100 | #93 | Exceptional 11.6% |
| Creek | 92.7 /100 | #94 | Exceptional 11.6% |
| Immigrants | Bosnia and Herzegovina | 92.6 /100 | #95 | Exceptional 11.6% |
| Immigrants | Sweden | 92.6 /100 | #96 | Exceptional 11.6% |
| Romanians | 92.3 /100 | #97 | Exceptional 11.6% |
| Immigrants | Japan | 91.9 /100 | #98 | Exceptional 11.6% |
| Immigrants | Ethiopia | 91.7 /100 | #99 | Exceptional 11.6% |
| Syrians | 91.1 /100 | #100 | Exceptional 11.6% |
| Jordanians | 90.8 /100 | #101 | Exceptional 11.6% |