Peruvian vs Basque Single Father Poverty
COMPARE
Peruvian
Basque
Single Father Poverty
Single Father Poverty Comparison
Peruvians
Basques
15.4%
SINGLE FATHER POVERTY
99.2/ 100
METRIC RATING
84th/ 347
METRIC RANK
15.5%
SINGLE FATHER POVERTY
98.4/ 100
METRIC RATING
93rd/ 347
METRIC RANK
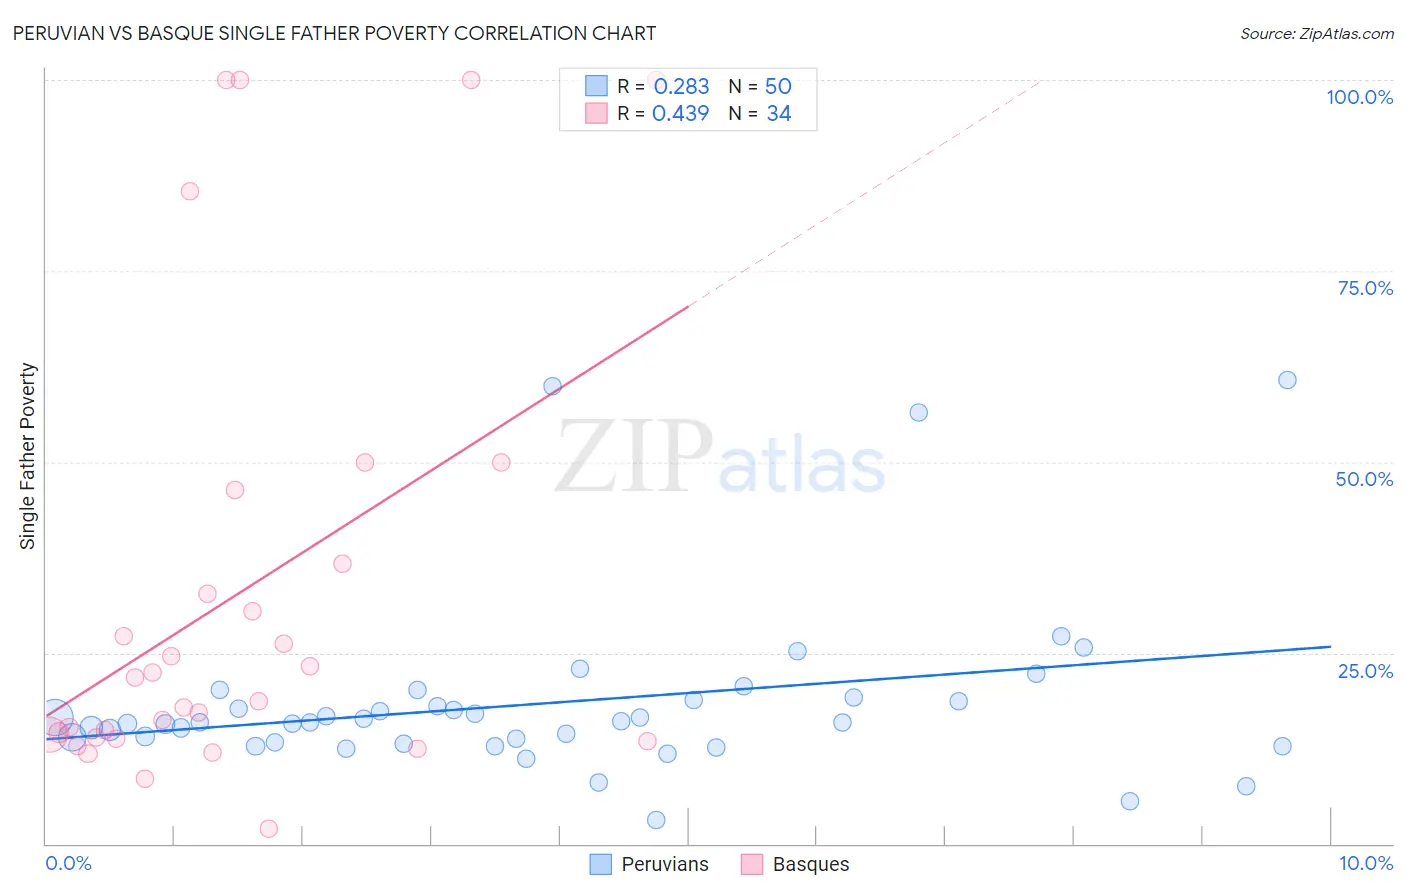
Peruvian vs Basque Single Father Poverty Correlation Chart
The statistical analysis conducted on geographies consisting of 291,336,331 people shows a weak positive correlation between the proportion of Peruvians and poverty level among single fathers in the United States with a correlation coefficient (R) of 0.283 and weighted average of 15.4%. Similarly, the statistical analysis conducted on geographies consisting of 144,984,159 people shows a moderate positive correlation between the proportion of Basques and poverty level among single fathers in the United States with a correlation coefficient (R) of 0.439 and weighted average of 15.5%, a difference of 0.82%.
Single Father Poverty Correlation Summary
| Measurement | Peruvian | Basque |
| Minimum | 3.1% | 2.0% |
| Maximum | 60.7% | 100.0% |
| Range | 57.7% | 98.0% |
| Mean | 18.4% | 32.5% |
| Median | 15.9% | 20.2% |
| Interquartile 25% (IQ1) | 13.3% | 13.9% |
| Interquartile 75% (IQ3) | 18.9% | 36.7% |
| Interquartile Range (IQR) | 5.6% | 22.8% |
| Standard Deviation (Sample) | 11.3% | 29.5% |
| Standard Deviation (Population) | 11.2% | 29.0% |
Demographics Similar to Peruvians and Basques by Single Father Poverty
In terms of single father poverty, the demographic groups most similar to Peruvians are Immigrants from Oceania (15.4%, a difference of 0.12%), Chinese (15.4%, a difference of 0.14%), Immigrants from Ukraine (15.4%, a difference of 0.22%), Immigrants from Congo (15.4%, a difference of 0.24%), and Immigrants from Russia (15.5%, a difference of 0.24%). Similarly, the demographic groups most similar to Basques are Immigrants from Serbia (15.5%, a difference of 0.040%), Immigrants from Uruguay (15.6%, a difference of 0.14%), Immigrants from Romania (15.5%, a difference of 0.15%), Immigrants from Kazakhstan (15.6%, a difference of 0.19%), and Immigrants from Belgium (15.6%, a difference of 0.20%).
| Demographics | Rating | Rank | Single Father Poverty |
| Tlingit-Haida | 99.5 /100 | #78 | Exceptional 15.3% |
| Immigrants | Northern Africa | 99.5 /100 | #79 | Exceptional 15.3% |
| Armenians | 99.4 /100 | #80 | Exceptional 15.4% |
| Immigrants | Congo | 99.4 /100 | #81 | Exceptional 15.4% |
| Immigrants | Ukraine | 99.4 /100 | #82 | Exceptional 15.4% |
| Chinese | 99.3 /100 | #83 | Exceptional 15.4% |
| Peruvians | 99.2 /100 | #84 | Exceptional 15.4% |
| Immigrants | Oceania | 99.1 /100 | #85 | Exceptional 15.4% |
| Immigrants | Russia | 99.0 /100 | #86 | Exceptional 15.5% |
| Brazilians | 99.0 /100 | #87 | Exceptional 15.5% |
| Burmese | 99.0 /100 | #88 | Exceptional 15.5% |
| Immigrants | Korea | 99.0 /100 | #89 | Exceptional 15.5% |
| Mexican American Indians | 98.7 /100 | #90 | Exceptional 15.5% |
| Immigrants | Romania | 98.6 /100 | #91 | Exceptional 15.5% |
| Immigrants | Serbia | 98.5 /100 | #92 | Exceptional 15.5% |
| Basques | 98.4 /100 | #93 | Exceptional 15.5% |
| Immigrants | Uruguay | 98.2 /100 | #94 | Exceptional 15.6% |
| Immigrants | Kazakhstan | 98.2 /100 | #95 | Exceptional 15.6% |
| Immigrants | Belgium | 98.1 /100 | #96 | Exceptional 15.6% |
| Yaqui | 98.1 /100 | #97 | Exceptional 15.6% |
| Zimbabweans | 98.1 /100 | #98 | Exceptional 15.6% |