Greek vs Liberian Receiving Food Stamps
COMPARE
Greek
Liberian
Receiving Food Stamps
Receiving Food Stamps Comparison
Greeks
Liberians
9.7%
RECEIVING FOOD STAMPS
99.3/ 100
METRIC RATING
57th/ 347
METRIC RANK
14.8%
RECEIVING FOOD STAMPS
0.1/ 100
METRIC RATING
276th/ 347
METRIC RANK
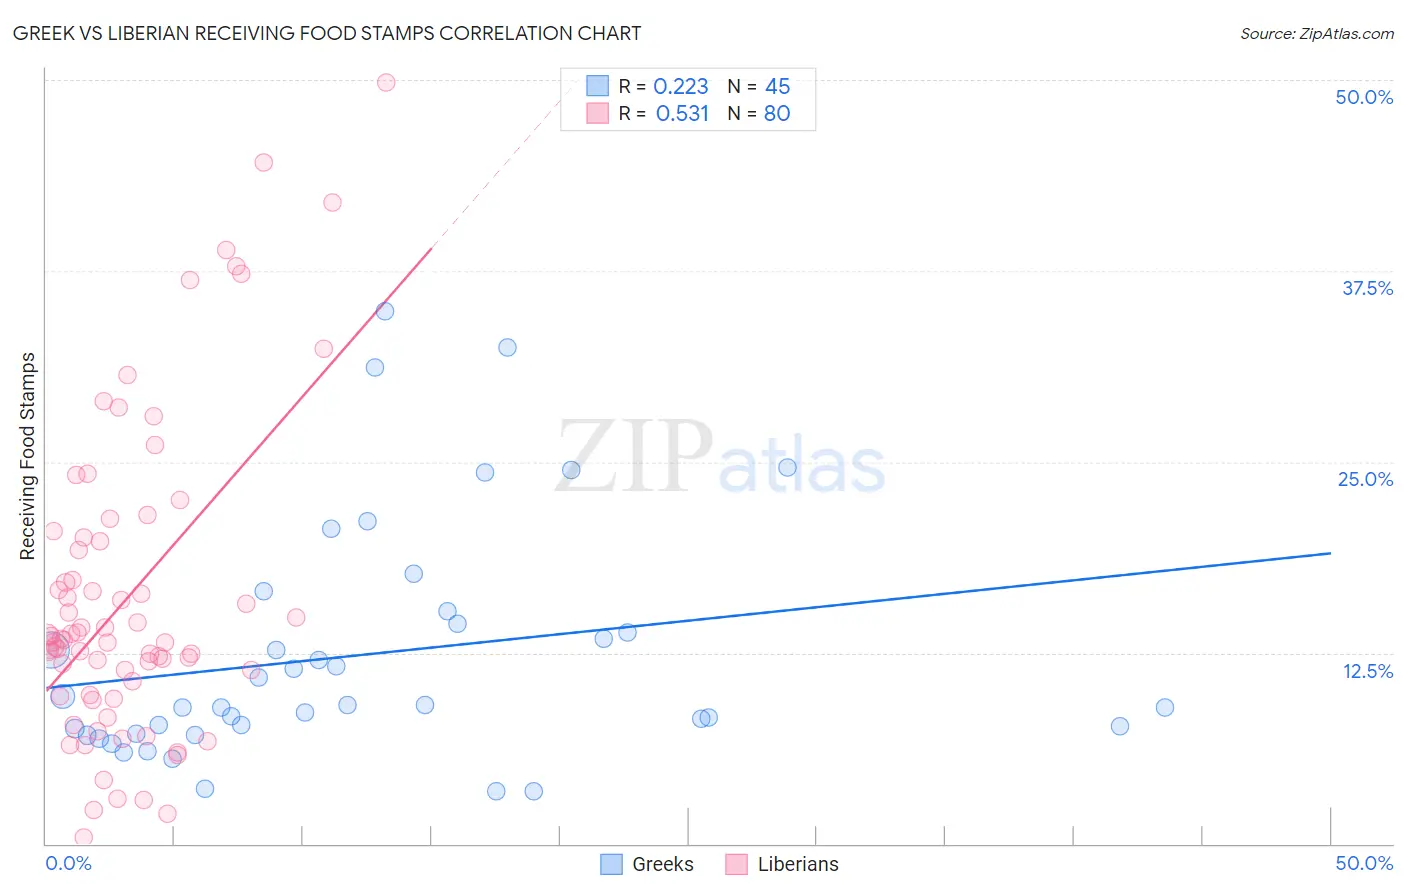
Greek vs Liberian Receiving Food Stamps Correlation Chart
The statistical analysis conducted on geographies consisting of 480,606,207 people shows a weak positive correlation between the proportion of Greeks and percentage of population receiving government assistance and/or food stamps in the United States with a correlation coefficient (R) of 0.223 and weighted average of 9.7%. Similarly, the statistical analysis conducted on geographies consisting of 118,008,708 people shows a substantial positive correlation between the proportion of Liberians and percentage of population receiving government assistance and/or food stamps in the United States with a correlation coefficient (R) of 0.531 and weighted average of 14.8%, a difference of 52.2%.
Receiving Food Stamps Correlation Summary
| Measurement | Greek | Liberian |
| Minimum | 3.4% | 0.40% |
| Maximum | 34.9% | 49.8% |
| Range | 31.5% | 49.4% |
| Mean | 12.4% | 16.2% |
| Median | 9.0% | 13.4% |
| Interquartile 25% (IQ1) | 7.4% | 10.2% |
| Interquartile 75% (IQ3) | 14.8% | 19.9% |
| Interquartile Range (IQR) | 7.4% | 9.7% |
| Standard Deviation (Sample) | 7.7% | 10.3% |
| Standard Deviation (Population) | 7.7% | 10.2% |
Similar Demographics by Receiving Food Stamps
Demographics Similar to Greeks by Receiving Food Stamps
In terms of receiving food stamps, the demographic groups most similar to Greeks are Scandinavian (9.7%, a difference of 0.060%), British (9.7%, a difference of 0.090%), Immigrants from Canada (9.7%, a difference of 0.11%), German (9.7%, a difference of 0.19%), and Immigrants from Switzerland (9.7%, a difference of 0.29%).
| Demographics | Rating | Rank | Receiving Food Stamps |
| Lithuanians | 99.4 /100 | #50 | Exceptional 9.7% |
| Asians | 99.3 /100 | #51 | Exceptional 9.7% |
| Immigrants | South Africa | 99.3 /100 | #52 | Exceptional 9.7% |
| Tongans | 99.3 /100 | #53 | Exceptional 9.7% |
| Swiss | 99.3 /100 | #54 | Exceptional 9.7% |
| Immigrants | Switzerland | 99.3 /100 | #55 | Exceptional 9.7% |
| Immigrants | Canada | 99.3 /100 | #56 | Exceptional 9.7% |
| Greeks | 99.3 /100 | #57 | Exceptional 9.7% |
| Scandinavians | 99.2 /100 | #58 | Exceptional 9.7% |
| British | 99.2 /100 | #59 | Exceptional 9.7% |
| Germans | 99.2 /100 | #60 | Exceptional 9.7% |
| English | 99.2 /100 | #61 | Exceptional 9.8% |
| Immigrants | Bulgaria | 99.2 /100 | #62 | Exceptional 9.8% |
| Chinese | 99.2 /100 | #63 | Exceptional 9.8% |
| Immigrants | North America | 99.2 /100 | #64 | Exceptional 9.8% |
Demographics Similar to Liberians by Receiving Food Stamps
In terms of receiving food stamps, the demographic groups most similar to Liberians are Seminole (14.8%, a difference of 0.050%), Belizean (14.8%, a difference of 0.18%), Kiowa (14.9%, a difference of 0.45%), Ecuadorian (14.9%, a difference of 0.50%), and Ute (14.7%, a difference of 0.71%).
| Demographics | Rating | Rank | Receiving Food Stamps |
| Nepalese | 0.1 /100 | #269 | Tragic 14.6% |
| Mexicans | 0.1 /100 | #270 | Tragic 14.6% |
| Immigrants | Guatemala | 0.1 /100 | #271 | Tragic 14.6% |
| Chippewa | 0.1 /100 | #272 | Tragic 14.7% |
| Alaskan Athabascans | 0.1 /100 | #273 | Tragic 14.7% |
| Immigrants | Western Africa | 0.1 /100 | #274 | Tragic 14.7% |
| Ute | 0.1 /100 | #275 | Tragic 14.7% |
| Liberians | 0.1 /100 | #276 | Tragic 14.8% |
| Seminole | 0.1 /100 | #277 | Tragic 14.8% |
| Belizeans | 0.1 /100 | #278 | Tragic 14.8% |
| Kiowa | 0.0 /100 | #279 | Tragic 14.9% |
| Ecuadorians | 0.0 /100 | #280 | Tragic 14.9% |
| Spanish American Indians | 0.0 /100 | #281 | Tragic 14.9% |
| Immigrants | Central America | 0.0 /100 | #282 | Tragic 15.0% |
| Bangladeshis | 0.0 /100 | #283 | Tragic 15.0% |