Afghan vs Liberian Receiving Food Stamps
COMPARE
Afghan
Liberian
Receiving Food Stamps
Receiving Food Stamps Comparison
Afghans
Liberians
10.7%
RECEIVING FOOD STAMPS
92.6/ 100
METRIC RATING
126th/ 347
METRIC RANK
14.8%
RECEIVING FOOD STAMPS
0.1/ 100
METRIC RATING
276th/ 347
METRIC RANK
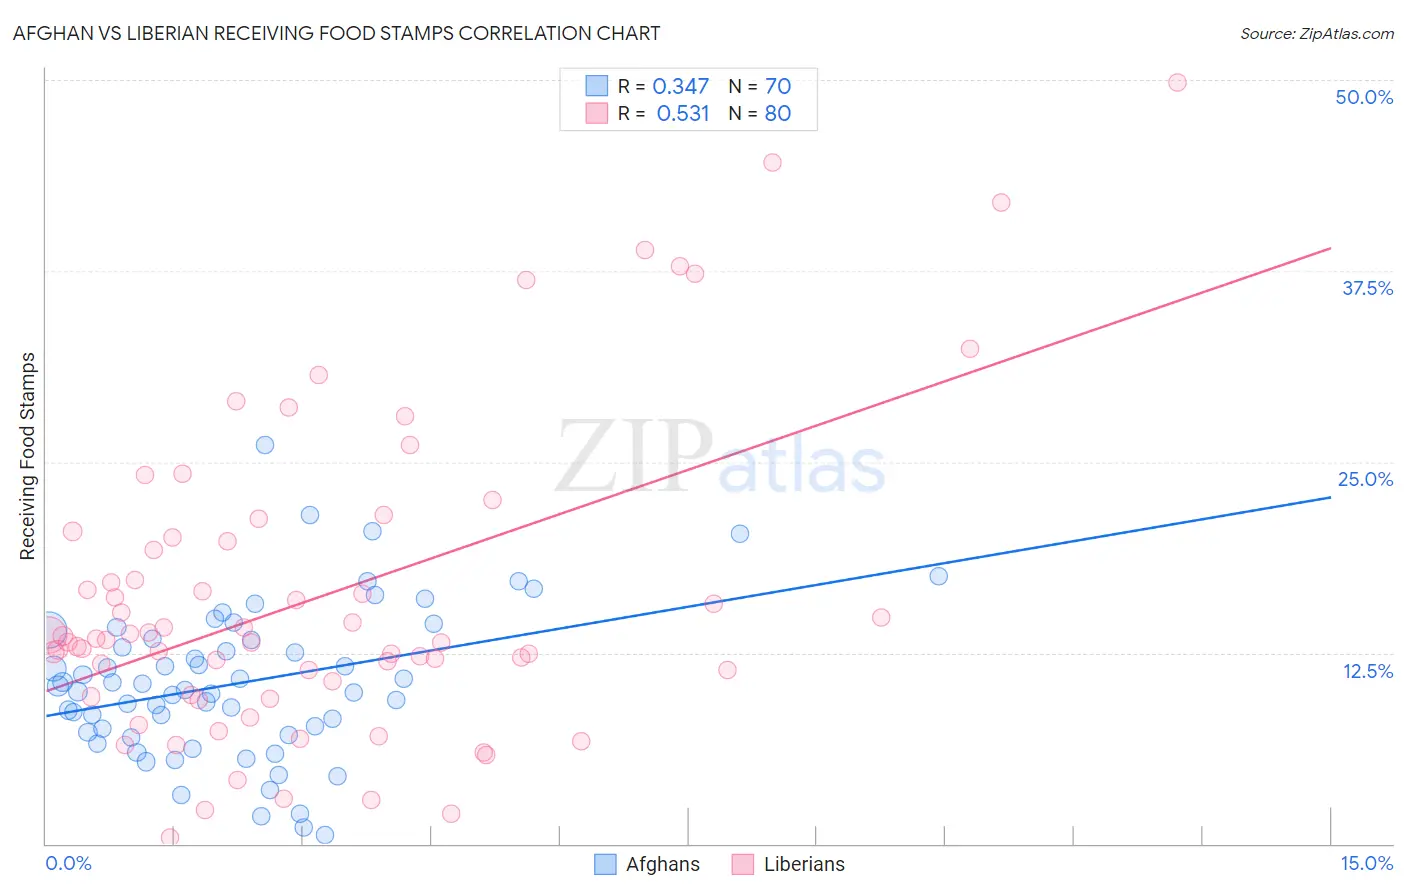
Afghan vs Liberian Receiving Food Stamps Correlation Chart
The statistical analysis conducted on geographies consisting of 148,722,422 people shows a mild positive correlation between the proportion of Afghans and percentage of population receiving government assistance and/or food stamps in the United States with a correlation coefficient (R) of 0.347 and weighted average of 10.7%. Similarly, the statistical analysis conducted on geographies consisting of 118,008,708 people shows a substantial positive correlation between the proportion of Liberians and percentage of population receiving government assistance and/or food stamps in the United States with a correlation coefficient (R) of 0.531 and weighted average of 14.8%, a difference of 38.3%.
Receiving Food Stamps Correlation Summary
| Measurement | Afghan | Liberian |
| Minimum | 0.60% | 0.40% |
| Maximum | 26.1% | 49.8% |
| Range | 25.5% | 49.4% |
| Mean | 10.5% | 16.2% |
| Median | 10.2% | 13.4% |
| Interquartile 25% (IQ1) | 7.3% | 10.2% |
| Interquartile 75% (IQ3) | 13.4% | 19.9% |
| Interquartile Range (IQR) | 6.1% | 9.7% |
| Standard Deviation (Sample) | 5.0% | 10.3% |
| Standard Deviation (Population) | 4.9% | 10.2% |
Similar Demographics by Receiving Food Stamps
Demographics Similar to Afghans by Receiving Food Stamps
In terms of receiving food stamps, the demographic groups most similar to Afghans are Immigrants from Ethiopia (10.7%, a difference of 0.020%), Immigrants from Jordan (10.7%, a difference of 0.030%), Yugoslavian (10.7%, a difference of 0.030%), Israeli (10.7%, a difference of 0.13%), and Ukrainian (10.7%, a difference of 0.14%).
| Demographics | Rating | Rank | Receiving Food Stamps |
| Immigrants | Poland | 93.9 /100 | #119 | Exceptional 10.6% |
| Ethiopians | 93.9 /100 | #120 | Exceptional 10.6% |
| Slavs | 93.8 /100 | #121 | Exceptional 10.6% |
| Sri Lankans | 93.7 /100 | #122 | Exceptional 10.6% |
| Immigrants | Philippines | 93.3 /100 | #123 | Exceptional 10.7% |
| Paraguayans | 93.0 /100 | #124 | Exceptional 10.7% |
| Ukrainians | 92.8 /100 | #125 | Exceptional 10.7% |
| Afghans | 92.6 /100 | #126 | Exceptional 10.7% |
| Immigrants | Ethiopia | 92.6 /100 | #127 | Exceptional 10.7% |
| Immigrants | Jordan | 92.5 /100 | #128 | Exceptional 10.7% |
| Yugoslavians | 92.5 /100 | #129 | Exceptional 10.7% |
| Israelis | 92.4 /100 | #130 | Exceptional 10.7% |
| French | 92.3 /100 | #131 | Exceptional 10.7% |
| Immigrants | Germany | 92.0 /100 | #132 | Exceptional 10.7% |
| Immigrants | Russia | 90.9 /100 | #133 | Exceptional 10.8% |
Demographics Similar to Liberians by Receiving Food Stamps
In terms of receiving food stamps, the demographic groups most similar to Liberians are Seminole (14.8%, a difference of 0.050%), Belizean (14.8%, a difference of 0.18%), Kiowa (14.9%, a difference of 0.45%), Ecuadorian (14.9%, a difference of 0.50%), and Ute (14.7%, a difference of 0.71%).
| Demographics | Rating | Rank | Receiving Food Stamps |
| Nepalese | 0.1 /100 | #269 | Tragic 14.6% |
| Mexicans | 0.1 /100 | #270 | Tragic 14.6% |
| Immigrants | Guatemala | 0.1 /100 | #271 | Tragic 14.6% |
| Chippewa | 0.1 /100 | #272 | Tragic 14.7% |
| Alaskan Athabascans | 0.1 /100 | #273 | Tragic 14.7% |
| Immigrants | Western Africa | 0.1 /100 | #274 | Tragic 14.7% |
| Ute | 0.1 /100 | #275 | Tragic 14.7% |
| Liberians | 0.1 /100 | #276 | Tragic 14.8% |
| Seminole | 0.1 /100 | #277 | Tragic 14.8% |
| Belizeans | 0.1 /100 | #278 | Tragic 14.8% |
| Kiowa | 0.0 /100 | #279 | Tragic 14.9% |
| Ecuadorians | 0.0 /100 | #280 | Tragic 14.9% |
| Spanish American Indians | 0.0 /100 | #281 | Tragic 14.9% |
| Immigrants | Central America | 0.0 /100 | #282 | Tragic 15.0% |
| Bangladeshis | 0.0 /100 | #283 | Tragic 15.0% |