Ghanaian vs Palestinian Receiving Food Stamps
COMPARE
Ghanaian
Palestinian
Receiving Food Stamps
Receiving Food Stamps Comparison
Ghanaians
Palestinians
14.0%
RECEIVING FOOD STAMPS
0.5/ 100
METRIC RATING
252nd/ 347
METRIC RANK
10.3%
RECEIVING FOOD STAMPS
96.9/ 100
METRIC RATING
101st/ 347
METRIC RANK
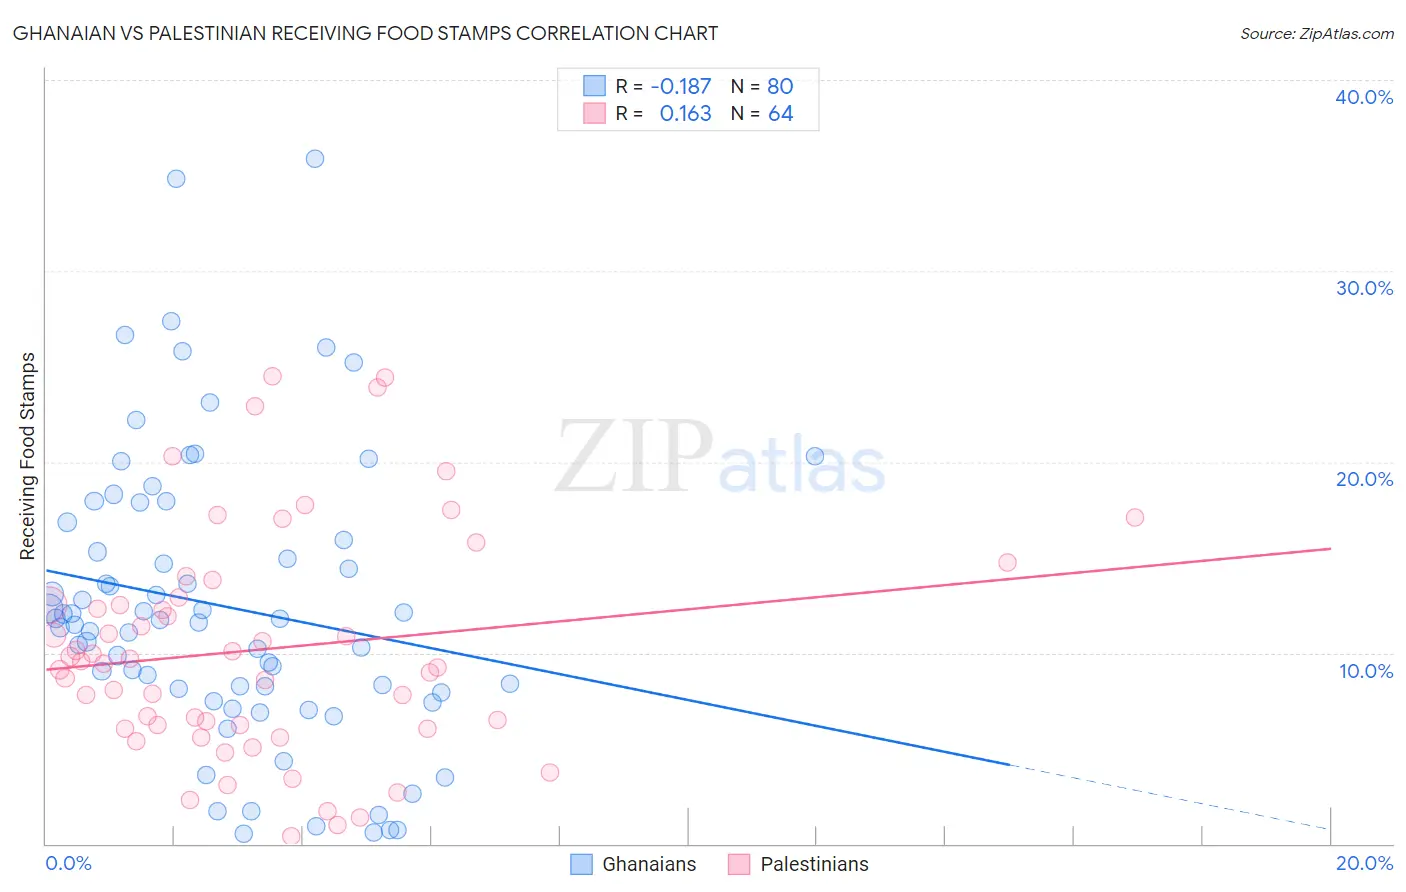
Ghanaian vs Palestinian Receiving Food Stamps Correlation Chart
The statistical analysis conducted on geographies consisting of 190,218,153 people shows a poor negative correlation between the proportion of Ghanaians and percentage of population receiving government assistance and/or food stamps in the United States with a correlation coefficient (R) of -0.187 and weighted average of 14.0%. Similarly, the statistical analysis conducted on geographies consisting of 216,153,739 people shows a poor positive correlation between the proportion of Palestinians and percentage of population receiving government assistance and/or food stamps in the United States with a correlation coefficient (R) of 0.163 and weighted average of 10.3%, a difference of 35.1%.
Receiving Food Stamps Correlation Summary
| Measurement | Ghanaian | Palestinian |
| Minimum | 0.50% | 0.40% |
| Maximum | 35.9% | 24.5% |
| Range | 35.4% | 24.1% |
| Mean | 12.4% | 10.2% |
| Median | 11.6% | 9.5% |
| Interquartile 25% (IQ1) | 8.0% | 6.1% |
| Interquartile 75% (IQ3) | 16.4% | 12.7% |
| Interquartile Range (IQR) | 8.3% | 6.6% |
| Standard Deviation (Sample) | 7.6% | 5.9% |
| Standard Deviation (Population) | 7.5% | 5.8% |
Similar Demographics by Receiving Food Stamps
Demographics Similar to Ghanaians by Receiving Food Stamps
In terms of receiving food stamps, the demographic groups most similar to Ghanaians are Spanish American (14.0%, a difference of 0.37%), Yaqui (13.9%, a difference of 0.44%), Immigrants from Cambodia (13.9%, a difference of 0.52%), Indonesian (13.9%, a difference of 0.69%), and Marshallese (14.1%, a difference of 0.97%).
| Demographics | Rating | Rank | Receiving Food Stamps |
| Immigrants | Somalia | 0.9 /100 | #245 | Tragic 13.7% |
| Cree | 0.8 /100 | #246 | Tragic 13.7% |
| Mexican American Indians | 0.7 /100 | #247 | Tragic 13.8% |
| Immigrants | Laos | 0.7 /100 | #248 | Tragic 13.8% |
| Indonesians | 0.6 /100 | #249 | Tragic 13.9% |
| Immigrants | Cambodia | 0.5 /100 | #250 | Tragic 13.9% |
| Yaqui | 0.5 /100 | #251 | Tragic 13.9% |
| Ghanaians | 0.5 /100 | #252 | Tragic 14.0% |
| Spanish Americans | 0.4 /100 | #253 | Tragic 14.0% |
| Marshallese | 0.3 /100 | #254 | Tragic 14.1% |
| Sub-Saharan Africans | 0.3 /100 | #255 | Tragic 14.1% |
| Japanese | 0.3 /100 | #256 | Tragic 14.1% |
| Arapaho | 0.3 /100 | #257 | Tragic 14.1% |
| Immigrants | Ghana | 0.3 /100 | #258 | Tragic 14.1% |
| Creek | 0.3 /100 | #259 | Tragic 14.1% |
Demographics Similar to Palestinians by Receiving Food Stamps
In terms of receiving food stamps, the demographic groups most similar to Palestinians are Immigrants from Western Europe (10.3%, a difference of 0.0%), Immigrants from Europe (10.3%, a difference of 0.090%), Serbian (10.3%, a difference of 0.13%), Immigrants from Latvia (10.3%, a difference of 0.18%), and Immigrants from Hungary (10.3%, a difference of 0.19%).
| Demographics | Rating | Rank | Receiving Food Stamps |
| Immigrants | Greece | 97.4 /100 | #94 | Exceptional 10.3% |
| Basques | 97.4 /100 | #95 | Exceptional 10.3% |
| Welsh | 97.3 /100 | #96 | Exceptional 10.3% |
| Czechoslovakians | 97.2 /100 | #97 | Exceptional 10.3% |
| Immigrants | Egypt | 97.1 /100 | #98 | Exceptional 10.3% |
| Serbians | 97.0 /100 | #99 | Exceptional 10.3% |
| Immigrants | Western Europe | 96.9 /100 | #100 | Exceptional 10.3% |
| Palestinians | 96.9 /100 | #101 | Exceptional 10.3% |
| Immigrants | Europe | 96.8 /100 | #102 | Exceptional 10.3% |
| Immigrants | Latvia | 96.8 /100 | #103 | Exceptional 10.3% |
| Immigrants | Hungary | 96.7 /100 | #104 | Exceptional 10.3% |
| Immigrants | Malaysia | 96.5 /100 | #105 | Exceptional 10.4% |
| Immigrants | Italy | 96.4 /100 | #106 | Exceptional 10.4% |
| Koreans | 96.3 /100 | #107 | Exceptional 10.4% |
| Carpatho Rusyns | 96.2 /100 | #108 | Exceptional 10.4% |