German vs Immigrants from Singapore Seniors Poverty Over the Age of 65
COMPARE
German
Immigrants from Singapore
Seniors Poverty Over the Age of 65
Seniors Poverty Over the Age of 65 Comparison
Germans
Immigrants from Singapore
9.0%
SENIORS POVERTY OVER THE AGE OF 65
100.0/ 100
METRIC RATING
7th/ 347
METRIC RANK
10.1%
SENIORS POVERTY OVER THE AGE OF 65
96.9/ 100
METRIC RATING
92nd/ 347
METRIC RANK
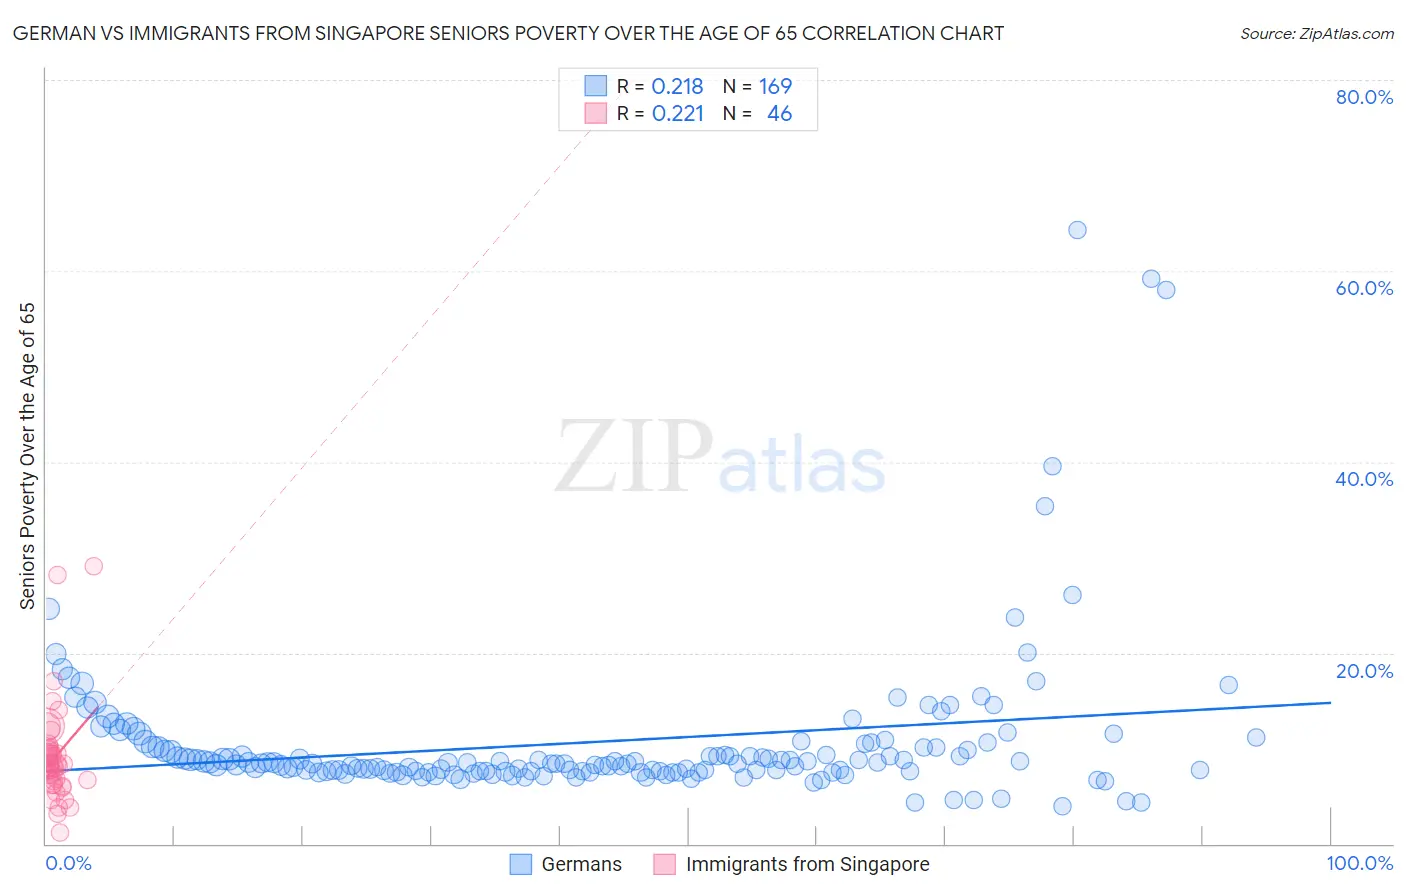
German vs Immigrants from Singapore Seniors Poverty Over the Age of 65 Correlation Chart
The statistical analysis conducted on geographies consisting of 574,200,569 people shows a weak positive correlation between the proportion of Germans and poverty level among seniors over the age of 65 in the United States with a correlation coefficient (R) of 0.218 and weighted average of 9.0%. Similarly, the statistical analysis conducted on geographies consisting of 137,241,054 people shows a weak positive correlation between the proportion of Immigrants from Singapore and poverty level among seniors over the age of 65 in the United States with a correlation coefficient (R) of 0.221 and weighted average of 10.1%, a difference of 12.9%.
Seniors Poverty Over the Age of 65 Correlation Summary
| Measurement | German | Immigrants from Singapore |
| Minimum | 3.9% | 1.1% |
| Maximum | 64.3% | 29.1% |
| Range | 60.4% | 27.9% |
| Mean | 10.7% | 9.1% |
| Median | 8.4% | 8.2% |
| Interquartile 25% (IQ1) | 7.6% | 6.6% |
| Interquartile 75% (IQ3) | 10.1% | 9.7% |
| Interquartile Range (IQR) | 2.5% | 3.1% |
| Standard Deviation (Sample) | 8.2% | 5.2% |
| Standard Deviation (Population) | 8.2% | 5.1% |
Similar Demographics by Seniors Poverty Over the Age of 65
Demographics Similar to Germans by Seniors Poverty Over the Age of 65
In terms of seniors poverty over the age of 65, the demographic groups most similar to Germans are Czech (9.0%, a difference of 0.53%), English (9.1%, a difference of 1.2%), Lithuanian (9.1%, a difference of 1.3%), Danish (8.8%, a difference of 1.6%), and Maltese (9.1%, a difference of 1.7%).
| Demographics | Rating | Rank | Seniors Poverty Over the Age of 65 |
| Chinese | 100.0 /100 | #1 | Exceptional 8.3% |
| Tlingit-Haida | 100.0 /100 | #2 | Exceptional 8.3% |
| Norwegians | 100.0 /100 | #3 | Exceptional 8.7% |
| Swedes | 100.0 /100 | #4 | Exceptional 8.7% |
| Immigrants | India | 100.0 /100 | #5 | Exceptional 8.8% |
| Danes | 100.0 /100 | #6 | Exceptional 8.8% |
| Germans | 100.0 /100 | #7 | Exceptional 9.0% |
| Czechs | 100.0 /100 | #8 | Exceptional 9.0% |
| English | 100.0 /100 | #9 | Exceptional 9.1% |
| Lithuanians | 100.0 /100 | #10 | Exceptional 9.1% |
| Maltese | 99.9 /100 | #11 | Exceptional 9.1% |
| Scandinavians | 99.9 /100 | #12 | Exceptional 9.1% |
| Croatians | 99.9 /100 | #13 | Exceptional 9.1% |
| Poles | 99.9 /100 | #14 | Exceptional 9.1% |
| Dutch | 99.9 /100 | #15 | Exceptional 9.1% |
Demographics Similar to Immigrants from Singapore by Seniors Poverty Over the Age of 65
In terms of seniors poverty over the age of 65, the demographic groups most similar to Immigrants from Singapore are Puget Sound Salish (10.1%, a difference of 0.020%), Ukrainian (10.1%, a difference of 0.040%), Immigrants from Bulgaria (10.1%, a difference of 0.10%), Immigrants from Sweden (10.1%, a difference of 0.11%), and Jordanian (10.1%, a difference of 0.18%).
| Demographics | Rating | Rank | Seniors Poverty Over the Age of 65 |
| Immigrants | Nepal | 97.2 /100 | #85 | Exceptional 10.1% |
| Romanians | 97.2 /100 | #86 | Exceptional 10.1% |
| Burmese | 97.2 /100 | #87 | Exceptional 10.1% |
| Jordanians | 97.1 /100 | #88 | Exceptional 10.1% |
| Immigrants | Bulgaria | 97.0 /100 | #89 | Exceptional 10.1% |
| Ukrainians | 96.9 /100 | #90 | Exceptional 10.1% |
| Puget Sound Salish | 96.9 /100 | #91 | Exceptional 10.1% |
| Immigrants | Singapore | 96.9 /100 | #92 | Exceptional 10.1% |
| Immigrants | Sweden | 96.7 /100 | #93 | Exceptional 10.1% |
| Immigrants | Germany | 96.7 /100 | #94 | Exceptional 10.1% |
| Immigrants | Japan | 96.3 /100 | #95 | Exceptional 10.1% |
| Basques | 95.9 /100 | #96 | Exceptional 10.2% |
| Immigrants | Pakistan | 95.7 /100 | #97 | Exceptional 10.2% |
| Immigrants | Kuwait | 95.5 /100 | #98 | Exceptional 10.2% |
| Cypriots | 95.5 /100 | #99 | Exceptional 10.2% |