German vs Immigrants from Singapore Unemployment Among Youth under 25 years
COMPARE
German
Immigrants from Singapore
Unemployment Among Youth under 25 years
Unemployment Among Youth under 25 years Comparison
Germans
Immigrants from Singapore
10.5%
UNEMPLOYMENT AMONG YOUTH UNDER 25 YEARS
100.0/ 100
METRIC RATING
9th/ 347
METRIC RANK
11.2%
UNEMPLOYMENT AMONG YOUTH UNDER 25 YEARS
97.8/ 100
METRIC RATING
65th/ 347
METRIC RANK
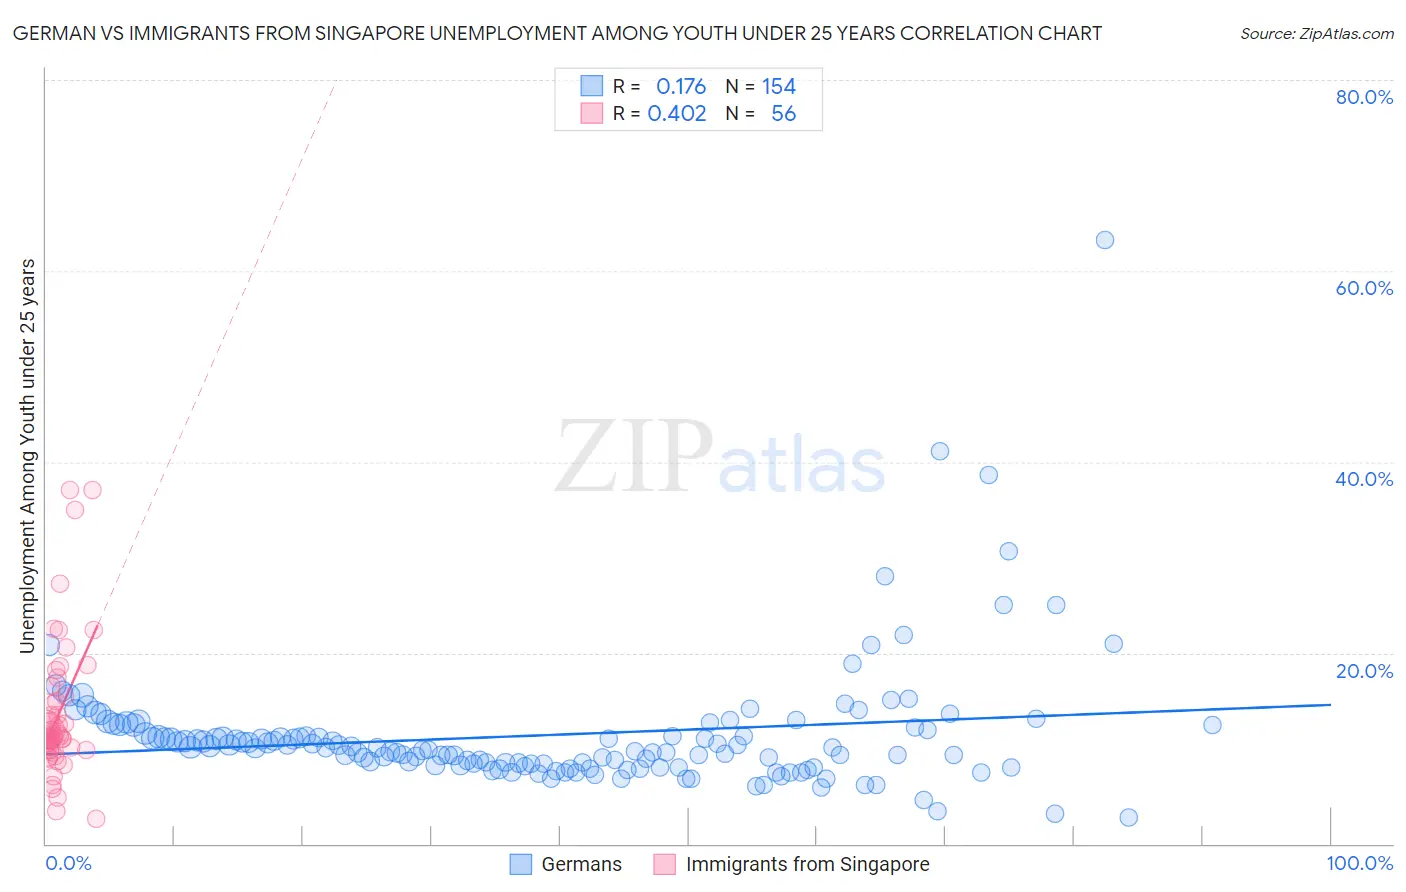
German vs Immigrants from Singapore Unemployment Among Youth under 25 years Correlation Chart
The statistical analysis conducted on geographies consisting of 552,720,168 people shows a poor positive correlation between the proportion of Germans and unemployment rate among youth under the age of 25 in the United States with a correlation coefficient (R) of 0.176 and weighted average of 10.5%. Similarly, the statistical analysis conducted on geographies consisting of 137,191,708 people shows a moderate positive correlation between the proportion of Immigrants from Singapore and unemployment rate among youth under the age of 25 in the United States with a correlation coefficient (R) of 0.402 and weighted average of 11.2%, a difference of 6.1%.
Unemployment Among Youth under 25 years Correlation Summary
| Measurement | German | Immigrants from Singapore |
| Minimum | 2.8% | 2.6% |
| Maximum | 63.2% | 37.1% |
| Range | 60.4% | 34.5% |
| Mean | 11.4% | 13.6% |
| Median | 10.1% | 11.3% |
| Interquartile 25% (IQ1) | 8.2% | 9.9% |
| Interquartile 75% (IQ3) | 11.9% | 15.2% |
| Interquartile Range (IQR) | 3.6% | 5.3% |
| Standard Deviation (Sample) | 6.8% | 7.3% |
| Standard Deviation (Population) | 6.7% | 7.2% |
Similar Demographics by Unemployment Among Youth under 25 years
Demographics Similar to Germans by Unemployment Among Youth under 25 years
In terms of unemployment among youth under 25 years, the demographic groups most similar to Germans are Immigrants from Somalia (10.5%, a difference of 0.020%), Scandinavian (10.5%, a difference of 0.15%), Immigrants from Sudan (10.5%, a difference of 0.33%), Immigrants from Venezuela (10.5%, a difference of 0.40%), and Indonesian (10.6%, a difference of 0.45%).
| Demographics | Rating | Rank | Unemployment Among Youth under 25 years |
| Immigrants | Cuba | 100.0 /100 | #2 | Exceptional 10.0% |
| Luxembourgers | 100.0 /100 | #3 | Exceptional 10.0% |
| Zimbabweans | 100.0 /100 | #4 | Exceptional 10.2% |
| Czechs | 100.0 /100 | #5 | Exceptional 10.3% |
| Danes | 100.0 /100 | #6 | Exceptional 10.3% |
| Swedes | 100.0 /100 | #7 | Exceptional 10.4% |
| Immigrants | Venezuela | 100.0 /100 | #8 | Exceptional 10.5% |
| Germans | 100.0 /100 | #9 | Exceptional 10.5% |
| Immigrants | Somalia | 100.0 /100 | #10 | Exceptional 10.5% |
| Scandinavians | 100.0 /100 | #11 | Exceptional 10.5% |
| Immigrants | Sudan | 100.0 /100 | #12 | Exceptional 10.5% |
| Indonesians | 100.0 /100 | #13 | Exceptional 10.6% |
| Cubans | 100.0 /100 | #14 | Exceptional 10.6% |
| Sudanese | 100.0 /100 | #15 | Exceptional 10.6% |
| Venezuelans | 100.0 /100 | #16 | Exceptional 10.6% |
Demographics Similar to Immigrants from Singapore by Unemployment Among Youth under 25 years
In terms of unemployment among youth under 25 years, the demographic groups most similar to Immigrants from Singapore are Macedonian (11.2%, a difference of 0.030%), Chickasaw (11.2%, a difference of 0.050%), Jordanian (11.1%, a difference of 0.060%), Immigrants from Kenya (11.2%, a difference of 0.070%), and Immigrants from Moldova (11.2%, a difference of 0.11%).
| Demographics | Rating | Rank | Unemployment Among Youth under 25 years |
| Scotch-Irish | 98.8 /100 | #58 | Exceptional 11.1% |
| Immigrants | Eastern Africa | 98.7 /100 | #59 | Exceptional 11.1% |
| South Africans | 98.5 /100 | #60 | Exceptional 11.1% |
| Filipinos | 98.3 /100 | #61 | Exceptional 11.1% |
| Immigrants | Netherlands | 98.1 /100 | #62 | Exceptional 11.1% |
| Immigrants | Croatia | 98.1 /100 | #63 | Exceptional 11.1% |
| Jordanians | 97.9 /100 | #64 | Exceptional 11.1% |
| Immigrants | Singapore | 97.8 /100 | #65 | Exceptional 11.2% |
| Macedonians | 97.7 /100 | #66 | Exceptional 11.2% |
| Chickasaw | 97.7 /100 | #67 | Exceptional 11.2% |
| Immigrants | Kenya | 97.6 /100 | #68 | Exceptional 11.2% |
| Immigrants | Moldova | 97.5 /100 | #69 | Exceptional 11.2% |
| Slavs | 97.5 /100 | #70 | Exceptional 11.2% |
| Bhutanese | 97.4 /100 | #71 | Exceptional 11.2% |
| Immigrants | Australia | 97.3 /100 | #72 | Exceptional 11.2% |