Immigrants from Romania vs Immigrants from Nigeria Single Mother Poverty
COMPARE
Immigrants from Romania
Immigrants from Nigeria
Single Mother Poverty
Single Mother Poverty Comparison
Immigrants from Romania
Immigrants from Nigeria
27.2%
SINGLE MOTHER POVERTY
99.7/ 100
METRIC RATING
56th/ 347
METRIC RANK
28.9%
SINGLE MOTHER POVERTY
65.9/ 100
METRIC RATING
163rd/ 347
METRIC RANK
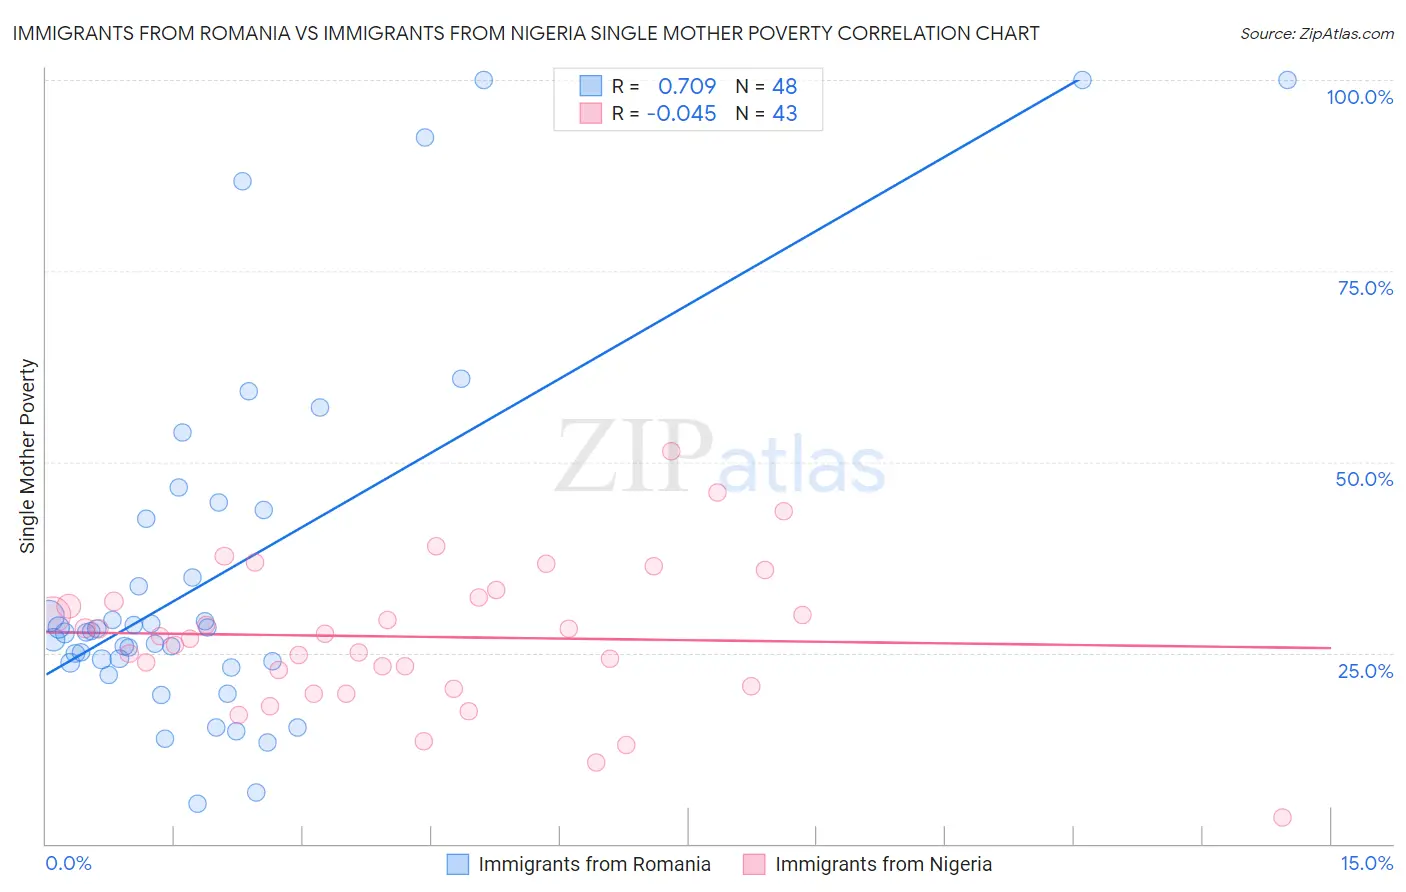
Immigrants from Romania vs Immigrants from Nigeria Single Mother Poverty Correlation Chart
The statistical analysis conducted on geographies consisting of 252,141,332 people shows a strong positive correlation between the proportion of Immigrants from Romania and poverty level among single mothers in the United States with a correlation coefficient (R) of 0.709 and weighted average of 27.2%. Similarly, the statistical analysis conducted on geographies consisting of 280,043,423 people shows no correlation between the proportion of Immigrants from Nigeria and poverty level among single mothers in the United States with a correlation coefficient (R) of -0.045 and weighted average of 28.9%, a difference of 6.6%.
Single Mother Poverty Correlation Summary
| Measurement | Immigrants from Romania | Immigrants from Nigeria |
| Minimum | 5.2% | 3.4% |
| Maximum | 100.0% | 51.4% |
| Range | 94.8% | 47.9% |
| Mean | 35.7% | 27.1% |
| Median | 27.8% | 27.2% |
| Interquartile 25% (IQ1) | 23.8% | 20.7% |
| Interquartile 75% (IQ3) | 43.1% | 32.3% |
| Interquartile Range (IQR) | 19.3% | 11.7% |
| Standard Deviation (Sample) | 24.1% | 9.4% |
| Standard Deviation (Population) | 23.8% | 9.3% |
Similar Demographics by Single Mother Poverty
Demographics Similar to Immigrants from Romania by Single Mother Poverty
In terms of single mother poverty, the demographic groups most similar to Immigrants from Romania are Palestinian (27.2%, a difference of 0.030%), Immigrants from Egypt (27.1%, a difference of 0.050%), Immigrants from Bulgaria (27.1%, a difference of 0.080%), Immigrants from Jordan (27.1%, a difference of 0.11%), and Immigrants from South Eastern Asia (27.1%, a difference of 0.15%).
| Demographics | Rating | Rank | Single Mother Poverty |
| Cambodians | 99.8 /100 | #49 | Exceptional 27.0% |
| Laotians | 99.8 /100 | #50 | Exceptional 27.0% |
| Immigrants | Argentina | 99.7 /100 | #51 | Exceptional 27.1% |
| Immigrants | South Eastern Asia | 99.7 /100 | #52 | Exceptional 27.1% |
| Immigrants | Jordan | 99.7 /100 | #53 | Exceptional 27.1% |
| Immigrants | Bulgaria | 99.7 /100 | #54 | Exceptional 27.1% |
| Immigrants | Egypt | 99.7 /100 | #55 | Exceptional 27.1% |
| Immigrants | Romania | 99.7 /100 | #56 | Exceptional 27.2% |
| Palestinians | 99.7 /100 | #57 | Exceptional 27.2% |
| Argentineans | 99.6 /100 | #58 | Exceptional 27.2% |
| Paraguayans | 99.6 /100 | #59 | Exceptional 27.2% |
| Eastern Europeans | 99.6 /100 | #60 | Exceptional 27.2% |
| Immigrants | Eastern Europe | 99.6 /100 | #61 | Exceptional 27.2% |
| Immigrants | Malaysia | 99.5 /100 | #62 | Exceptional 27.3% |
| Immigrants | Northern Europe | 99.5 /100 | #63 | Exceptional 27.3% |
Demographics Similar to Immigrants from Nigeria by Single Mother Poverty
In terms of single mother poverty, the demographic groups most similar to Immigrants from Nigeria are Immigrants from Kenya (28.9%, a difference of 0.0%), Scandinavian (28.9%, a difference of 0.020%), Immigrants from Cambodia (28.9%, a difference of 0.040%), Japanese (28.9%, a difference of 0.11%), and Czech (28.9%, a difference of 0.14%).
| Demographics | Rating | Rank | Single Mother Poverty |
| Iraqis | 71.5 /100 | #156 | Good 28.8% |
| Immigrants | Western Europe | 71.1 /100 | #157 | Good 28.9% |
| Immigrants | Hungary | 70.6 /100 | #158 | Good 28.9% |
| Czechs | 68.4 /100 | #159 | Good 28.9% |
| Japanese | 68.0 /100 | #160 | Good 28.9% |
| Immigrants | Cambodia | 66.6 /100 | #161 | Good 28.9% |
| Scandinavians | 66.2 /100 | #162 | Good 28.9% |
| Immigrants | Nigeria | 65.9 /100 | #163 | Good 28.9% |
| Immigrants | Kenya | 65.9 /100 | #164 | Good 28.9% |
| Arabs | 60.7 /100 | #165 | Good 29.0% |
| Inupiat | 60.4 /100 | #166 | Good 29.0% |
| Costa Ricans | 58.4 /100 | #167 | Average 29.0% |
| Europeans | 57.6 /100 | #168 | Average 29.1% |
| Immigrants | Uruguay | 57.2 /100 | #169 | Average 29.1% |
| New Zealanders | 55.1 /100 | #170 | Average 29.1% |