German Russian vs Black/African American Family Poverty
COMPARE
German Russian
Black/African American
Family Poverty
Family Poverty Comparison
German Russians
Blacks/African Americans
9.4%
FAMILY POVERTY
19.4/ 100
METRIC RATING
203rd/ 347
METRIC RANK
13.3%
FAMILY POVERTY
0.0/ 100
METRIC RATING
329th/ 347
METRIC RANK
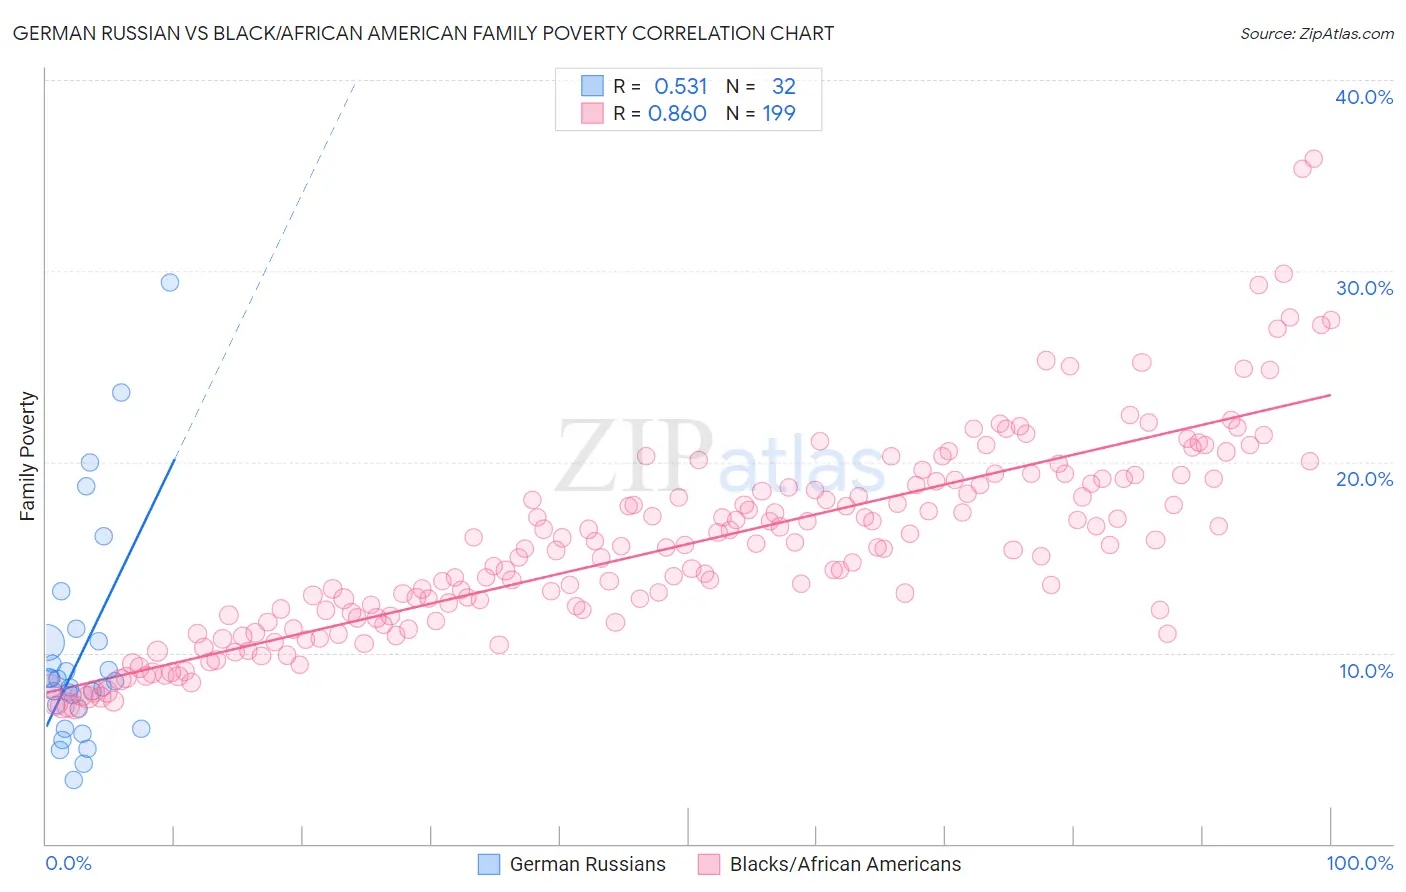
German Russian vs Black/African American Family Poverty Correlation Chart
The statistical analysis conducted on geographies consisting of 96,398,519 people shows a substantial positive correlation between the proportion of German Russians and poverty level among families in the United States with a correlation coefficient (R) of 0.531 and weighted average of 9.4%. Similarly, the statistical analysis conducted on geographies consisting of 562,121,260 people shows a very strong positive correlation between the proportion of Blacks/African Americans and poverty level among families in the United States with a correlation coefficient (R) of 0.860 and weighted average of 13.3%, a difference of 41.4%.
Family Poverty Correlation Summary
| Measurement | German Russian | Black/African American |
| Minimum | 3.4% | 7.2% |
| Maximum | 29.4% | 35.9% |
| Range | 26.0% | 28.7% |
| Mean | 10.0% | 15.7% |
| Median | 8.4% | 15.5% |
| Interquartile 25% (IQ1) | 6.5% | 11.8% |
| Interquartile 75% (IQ3) | 10.6% | 18.8% |
| Interquartile Range (IQR) | 4.1% | 7.0% |
| Standard Deviation (Sample) | 5.8% | 5.2% |
| Standard Deviation (Population) | 5.7% | 5.2% |
Similar Demographics by Family Poverty
Demographics Similar to German Russians by Family Poverty
In terms of family poverty, the demographic groups most similar to German Russians are Immigrants from Sierra Leone (9.4%, a difference of 0.040%), Immigrants from Lebanon (9.4%, a difference of 0.10%), Immigrants from Portugal (9.4%, a difference of 0.21%), Aleut (9.5%, a difference of 0.29%), and Immigrants from South America (9.5%, a difference of 0.30%).
| Demographics | Rating | Rank | Family Poverty |
| Immigrants | Venezuela | 26.1 /100 | #196 | Fair 9.3% |
| Immigrants | Colombia | 24.4 /100 | #197 | Fair 9.3% |
| Iraqis | 24.2 /100 | #198 | Fair 9.3% |
| Spaniards | 22.8 /100 | #199 | Fair 9.4% |
| Immigrants | Costa Rica | 21.7 /100 | #200 | Fair 9.4% |
| Immigrants | Portugal | 20.5 /100 | #201 | Fair 9.4% |
| Immigrants | Sierra Leone | 19.6 /100 | #202 | Poor 9.4% |
| German Russians | 19.4 /100 | #203 | Poor 9.4% |
| Immigrants | Lebanon | 18.9 /100 | #204 | Poor 9.4% |
| Aleuts | 18.0 /100 | #205 | Poor 9.5% |
| Immigrants | South America | 18.0 /100 | #206 | Poor 9.5% |
| Sierra Leoneans | 15.6 /100 | #207 | Poor 9.5% |
| Immigrants | Eastern Africa | 15.1 /100 | #208 | Poor 9.5% |
| Immigrants | Uruguay | 14.0 /100 | #209 | Poor 9.5% |
| Alsatians | 11.3 /100 | #210 | Poor 9.6% |
Demographics Similar to Blacks/African Americans by Family Poverty
In terms of family poverty, the demographic groups most similar to Blacks/African Americans are Central American Indian (13.3%, a difference of 0.17%), Yakama (13.1%, a difference of 1.8%), Colville (13.0%, a difference of 2.5%), Paiute (13.0%, a difference of 2.6%), and Immigrants from Dominica (12.7%, a difference of 4.6%).
| Demographics | Rating | Rank | Family Poverty |
| Immigrants | Honduras | 0.0 /100 | #322 | Tragic 12.7% |
| Menominee | 0.0 /100 | #323 | Tragic 12.7% |
| Immigrants | Dominica | 0.0 /100 | #324 | Tragic 12.7% |
| Paiute | 0.0 /100 | #325 | Tragic 13.0% |
| Colville | 0.0 /100 | #326 | Tragic 13.0% |
| Yakama | 0.0 /100 | #327 | Tragic 13.1% |
| Central American Indians | 0.0 /100 | #328 | Tragic 13.3% |
| Blacks/African Americans | 0.0 /100 | #329 | Tragic 13.3% |
| Natives/Alaskans | 0.0 /100 | #330 | Tragic 14.3% |
| Cheyenne | 0.0 /100 | #331 | Tragic 14.3% |
| Dominicans | 0.0 /100 | #332 | Tragic 14.3% |
| Immigrants | Dominican Republic | 0.0 /100 | #333 | Tragic 14.4% |
| Houma | 0.0 /100 | #334 | Tragic 14.6% |
| Apache | 0.0 /100 | #335 | Tragic 14.7% |
| Sioux | 0.0 /100 | #336 | Tragic 15.9% |