Immigrants from Singapore vs Vietnamese Family Poverty
COMPARE
Immigrants from Singapore
Vietnamese
Family Poverty
Family Poverty Comparison
Immigrants from Singapore
Vietnamese
7.1%
FAMILY POVERTY
99.8/ 100
METRIC RATING
11th/ 347
METRIC RANK
11.5%
FAMILY POVERTY
0.0/ 100
METRIC RATING
287th/ 347
METRIC RANK
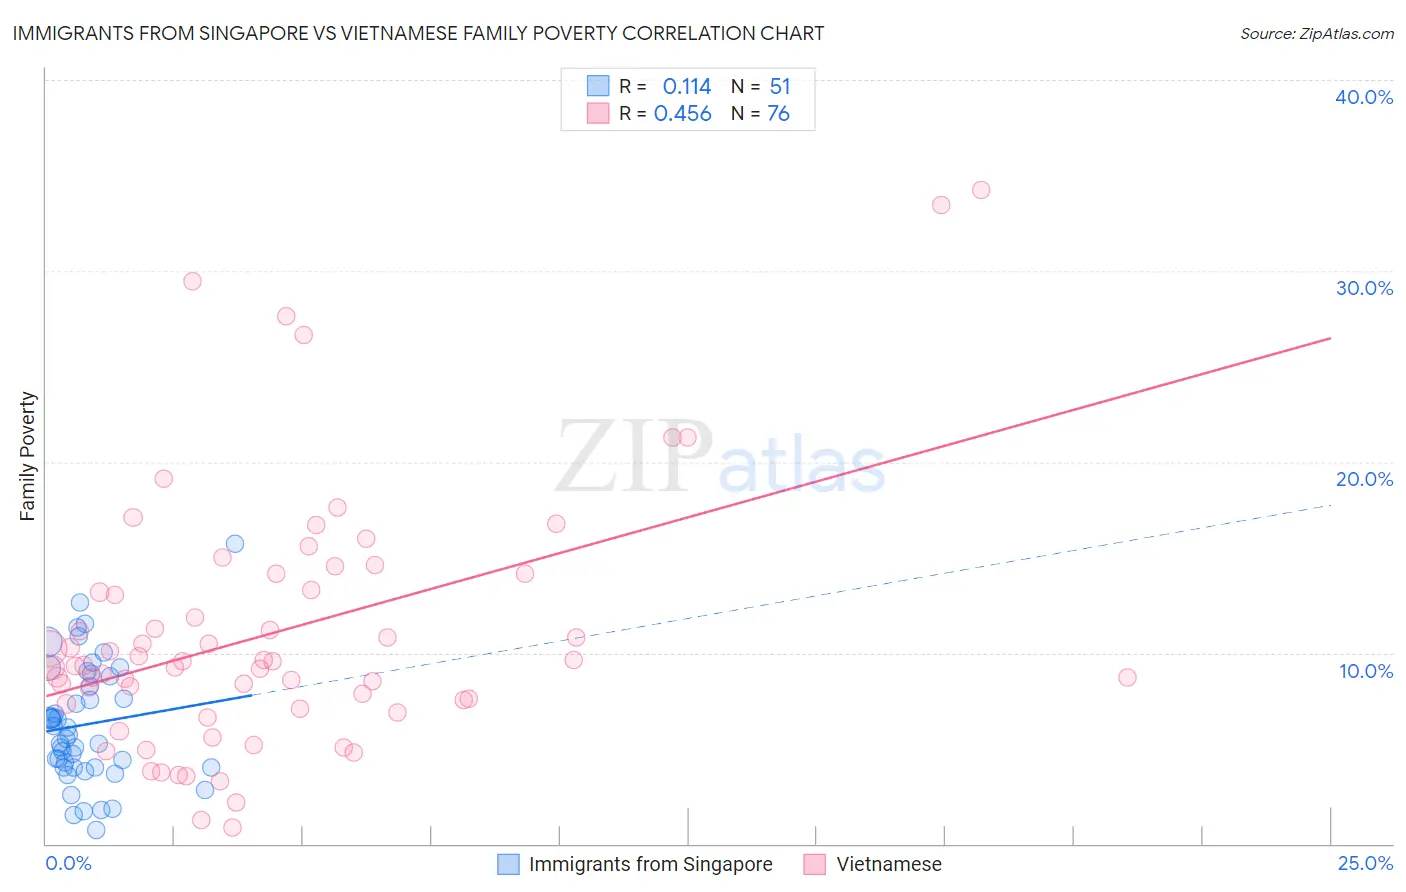
Immigrants from Singapore vs Vietnamese Family Poverty Correlation Chart
The statistical analysis conducted on geographies consisting of 137,322,674 people shows a poor positive correlation between the proportion of Immigrants from Singapore and poverty level among families in the United States with a correlation coefficient (R) of 0.114 and weighted average of 7.1%. Similarly, the statistical analysis conducted on geographies consisting of 170,550,296 people shows a moderate positive correlation between the proportion of Vietnamese and poverty level among families in the United States with a correlation coefficient (R) of 0.456 and weighted average of 11.5%, a difference of 62.0%.
Family Poverty Correlation Summary
| Measurement | Immigrants from Singapore | Vietnamese |
| Minimum | 0.70% | 0.88% |
| Maximum | 15.7% | 34.2% |
| Range | 15.0% | 33.4% |
| Mean | 6.2% | 11.1% |
| Median | 5.7% | 9.4% |
| Interquartile 25% (IQ1) | 4.0% | 7.4% |
| Interquartile 75% (IQ3) | 8.8% | 13.7% |
| Interquartile Range (IQR) | 4.8% | 6.3% |
| Standard Deviation (Sample) | 3.2% | 6.8% |
| Standard Deviation (Population) | 3.1% | 6.7% |
Similar Demographics by Family Poverty
Demographics Similar to Immigrants from Singapore by Family Poverty
In terms of family poverty, the demographic groups most similar to Immigrants from Singapore are Bulgarian (7.1%, a difference of 0.010%), Latvian (7.1%, a difference of 0.27%), Maltese (7.1%, a difference of 0.29%), Swedish (7.1%, a difference of 0.34%), and Iranian (7.1%, a difference of 0.34%).
| Demographics | Rating | Rank | Family Poverty |
| Filipinos | 100.0 /100 | #4 | Exceptional 6.6% |
| Thais | 100.0 /100 | #5 | Exceptional 6.7% |
| Norwegians | 99.9 /100 | #6 | Exceptional 6.9% |
| Immigrants | Ireland | 99.9 /100 | #7 | Exceptional 7.0% |
| Bhutanese | 99.9 /100 | #8 | Exceptional 7.0% |
| Latvians | 99.9 /100 | #9 | Exceptional 7.1% |
| Bulgarians | 99.8 /100 | #10 | Exceptional 7.1% |
| Immigrants | Singapore | 99.8 /100 | #11 | Exceptional 7.1% |
| Maltese | 99.8 /100 | #12 | Exceptional 7.1% |
| Swedes | 99.8 /100 | #13 | Exceptional 7.1% |
| Iranians | 99.8 /100 | #14 | Exceptional 7.1% |
| Lithuanians | 99.8 /100 | #15 | Exceptional 7.2% |
| Immigrants | South Central Asia | 99.8 /100 | #16 | Exceptional 7.2% |
| Luxembourgers | 99.8 /100 | #17 | Exceptional 7.2% |
| Immigrants | Lithuania | 99.8 /100 | #18 | Exceptional 7.2% |
Demographics Similar to Vietnamese by Family Poverty
In terms of family poverty, the demographic groups most similar to Vietnamese are Immigrants from Belize (11.5%, a difference of 0.19%), Immigrants from Barbados (11.5%, a difference of 0.24%), West Indian (11.5%, a difference of 0.25%), Senegalese (11.5%, a difference of 0.27%), and Haitian (11.5%, a difference of 0.31%).
| Demographics | Rating | Rank | Family Poverty |
| Belizeans | 0.0 /100 | #280 | Tragic 11.3% |
| Immigrants | West Indies | 0.0 /100 | #281 | Tragic 11.3% |
| Immigrants | Cuba | 0.0 /100 | #282 | Tragic 11.3% |
| Indonesians | 0.0 /100 | #283 | Tragic 11.3% |
| Yaqui | 0.0 /100 | #284 | Tragic 11.3% |
| Barbadians | 0.0 /100 | #285 | Tragic 11.3% |
| Senegalese | 0.0 /100 | #286 | Tragic 11.5% |
| Vietnamese | 0.0 /100 | #287 | Tragic 11.5% |
| Immigrants | Belize | 0.0 /100 | #288 | Tragic 11.5% |
| Immigrants | Barbados | 0.0 /100 | #289 | Tragic 11.5% |
| West Indians | 0.0 /100 | #290 | Tragic 11.5% |
| Haitians | 0.0 /100 | #291 | Tragic 11.5% |
| Immigrants | Somalia | 0.0 /100 | #292 | Tragic 11.5% |
| Immigrants | Cabo Verde | 0.0 /100 | #293 | Tragic 11.6% |
| Immigrants | St. Vincent and the Grenadines | 0.0 /100 | #294 | Tragic 11.6% |