German Russian vs Puerto Rican Child Poverty Among Boys Under 16
COMPARE
German Russian
Puerto Rican
Child Poverty Among Boys Under 16
Child Poverty Among Boys Under 16 Comparison
German Russians
Puerto Ricans
17.4%
CHILD POVERTY AMONG BOYS UNDER 16
10.9/ 100
METRIC RATING
206th/ 347
METRIC RANK
32.8%
CHILD POVERTY AMONG BOYS UNDER 16
0.0/ 100
METRIC RATING
347th/ 347
METRIC RANK
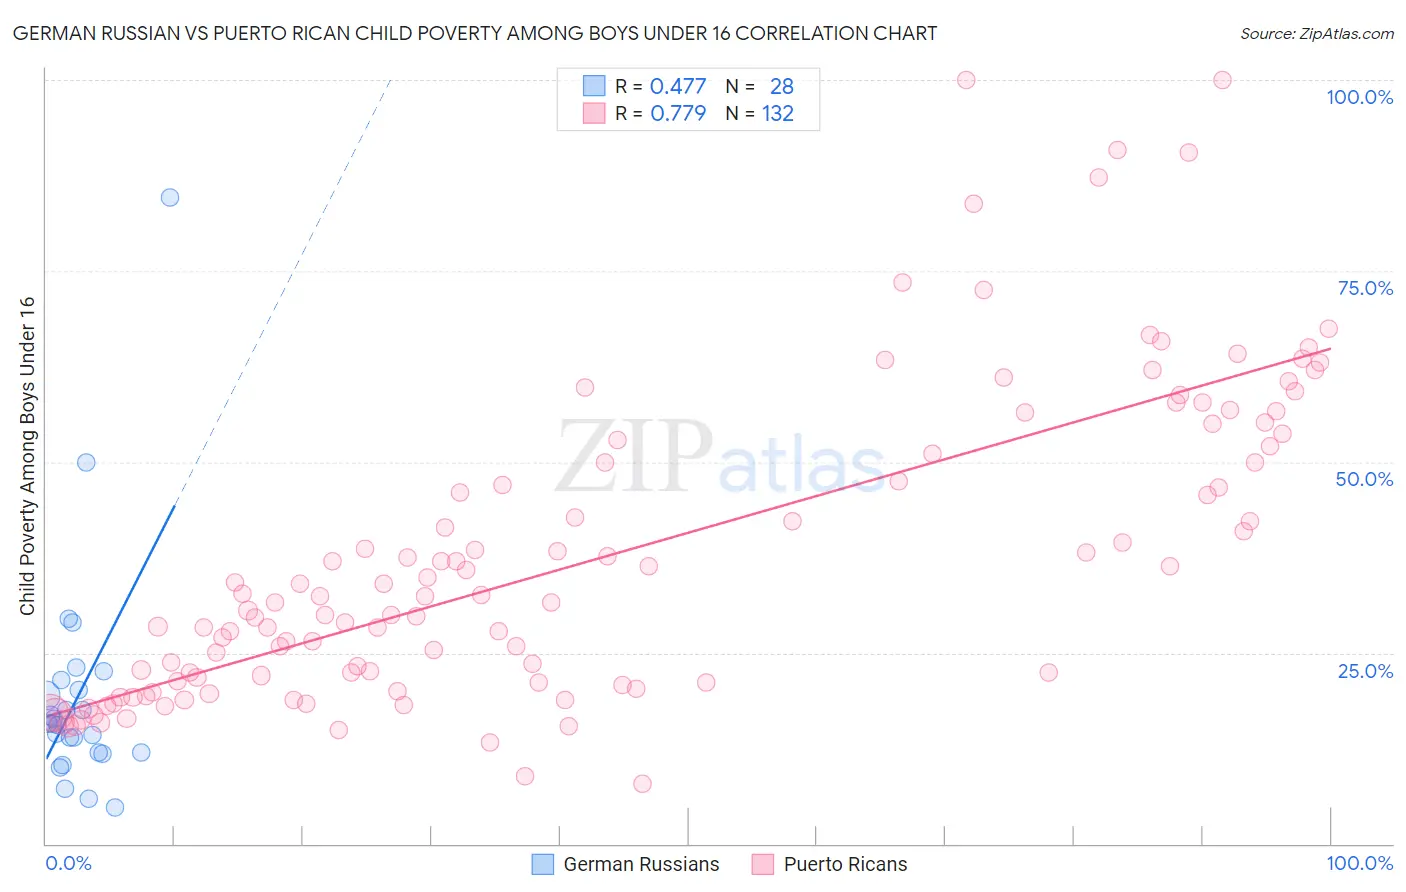
German Russian vs Puerto Rican Child Poverty Among Boys Under 16 Correlation Chart
The statistical analysis conducted on geographies consisting of 95,990,905 people shows a moderate positive correlation between the proportion of German Russians and poverty level among boys under the age of 16 in the United States with a correlation coefficient (R) of 0.477 and weighted average of 17.4%. Similarly, the statistical analysis conducted on geographies consisting of 514,590,520 people shows a strong positive correlation between the proportion of Puerto Ricans and poverty level among boys under the age of 16 in the United States with a correlation coefficient (R) of 0.779 and weighted average of 32.8%, a difference of 88.8%.
Child Poverty Among Boys Under 16 Correlation Summary
| Measurement | German Russian | Puerto Rican |
| Minimum | 4.7% | 7.9% |
| Maximum | 84.6% | 100.0% |
| Range | 79.9% | 92.1% |
| Mean | 19.5% | 37.5% |
| Median | 15.7% | 32.4% |
| Interquartile 25% (IQ1) | 12.0% | 21.2% |
| Interquartile 75% (IQ3) | 20.8% | 51.6% |
| Interquartile Range (IQR) | 8.8% | 30.4% |
| Standard Deviation (Sample) | 15.5% | 20.1% |
| Standard Deviation (Population) | 15.2% | 20.0% |
Similar Demographics by Child Poverty Among Boys Under 16
Demographics Similar to German Russians by Child Poverty Among Boys Under 16
In terms of child poverty among boys under 16, the demographic groups most similar to German Russians are Immigrants from Portugal (17.4%, a difference of 0.060%), Ugandan (17.3%, a difference of 0.39%), Immigrants from Uzbekistan (17.3%, a difference of 0.59%), Immigrants from Sierra Leone (17.3%, a difference of 0.61%), and Immigrants from Afghanistan (17.3%, a difference of 0.68%).
| Demographics | Rating | Rank | Child Poverty Among Boys Under 16 |
| Delaware | 18.8 /100 | #199 | Poor 17.1% |
| Immigrants | Uruguay | 16.9 /100 | #200 | Poor 17.2% |
| Immigrants | Afghanistan | 13.7 /100 | #201 | Poor 17.3% |
| Immigrants | Sierra Leone | 13.4 /100 | #202 | Poor 17.3% |
| Immigrants | Uzbekistan | 13.3 /100 | #203 | Poor 17.3% |
| Ugandans | 12.5 /100 | #204 | Poor 17.3% |
| Immigrants | Portugal | 11.2 /100 | #205 | Poor 17.4% |
| German Russians | 10.9 /100 | #206 | Poor 17.4% |
| Immigrants | Thailand | 8.2 /100 | #207 | Tragic 17.5% |
| Malaysians | 7.6 /100 | #208 | Tragic 17.6% |
| Alaskan Athabascans | 7.3 /100 | #209 | Tragic 17.6% |
| Immigrants | Armenia | 6.8 /100 | #210 | Tragic 17.6% |
| Immigrants | Immigrants | 6.7 /100 | #211 | Tragic 17.6% |
| Aleuts | 6.6 /100 | #212 | Tragic 17.7% |
| Immigrants | Eastern Africa | 6.0 /100 | #213 | Tragic 17.7% |
Demographics Similar to Puerto Ricans by Child Poverty Among Boys Under 16
In terms of child poverty among boys under 16, the demographic groups most similar to Puerto Ricans are Lumbee (31.9%, a difference of 2.9%), Tohono O'odham (31.6%, a difference of 4.1%), Yuman (30.6%, a difference of 7.2%), Navajo (30.3%, a difference of 8.4%), and Pima (29.7%, a difference of 10.4%).
| Demographics | Rating | Rank | Child Poverty Among Boys Under 16 |
| Apache | 0.0 /100 | #333 | Tragic 24.5% |
| Blacks/African Americans | 0.0 /100 | #334 | Tragic 24.5% |
| Yup'ik | 0.0 /100 | #335 | Tragic 24.7% |
| Sioux | 0.0 /100 | #336 | Tragic 25.3% |
| Cheyenne | 0.0 /100 | #337 | Tragic 25.8% |
| Hopi | 0.0 /100 | #338 | Tragic 25.9% |
| Houma | 0.0 /100 | #339 | Tragic 26.2% |
| Crow | 0.0 /100 | #340 | Tragic 26.3% |
| Immigrants | Yemen | 0.0 /100 | #341 | Tragic 28.9% |
| Pima | 0.0 /100 | #342 | Tragic 29.7% |
| Navajo | 0.0 /100 | #343 | Tragic 30.3% |
| Yuman | 0.0 /100 | #344 | Tragic 30.6% |
| Tohono O'odham | 0.0 /100 | #345 | Tragic 31.6% |
| Lumbee | 0.0 /100 | #346 | Tragic 31.9% |
| Puerto Ricans | 0.0 /100 | #347 | Tragic 32.8% |