German Russian vs Black/African American Disability Age 18 to 34
COMPARE
German Russian
Black/African American
Disability Age 18 to 34
Disability Age 18 to 34 Comparison
German Russians
Blacks/African Americans
7.4%
DISABILITY AGE 18 TO 34
0.1/ 100
METRIC RATING
266th/ 347
METRIC RANK
7.7%
DISABILITY AGE 18 TO 34
0.0/ 100
METRIC RATING
292nd/ 347
METRIC RANK
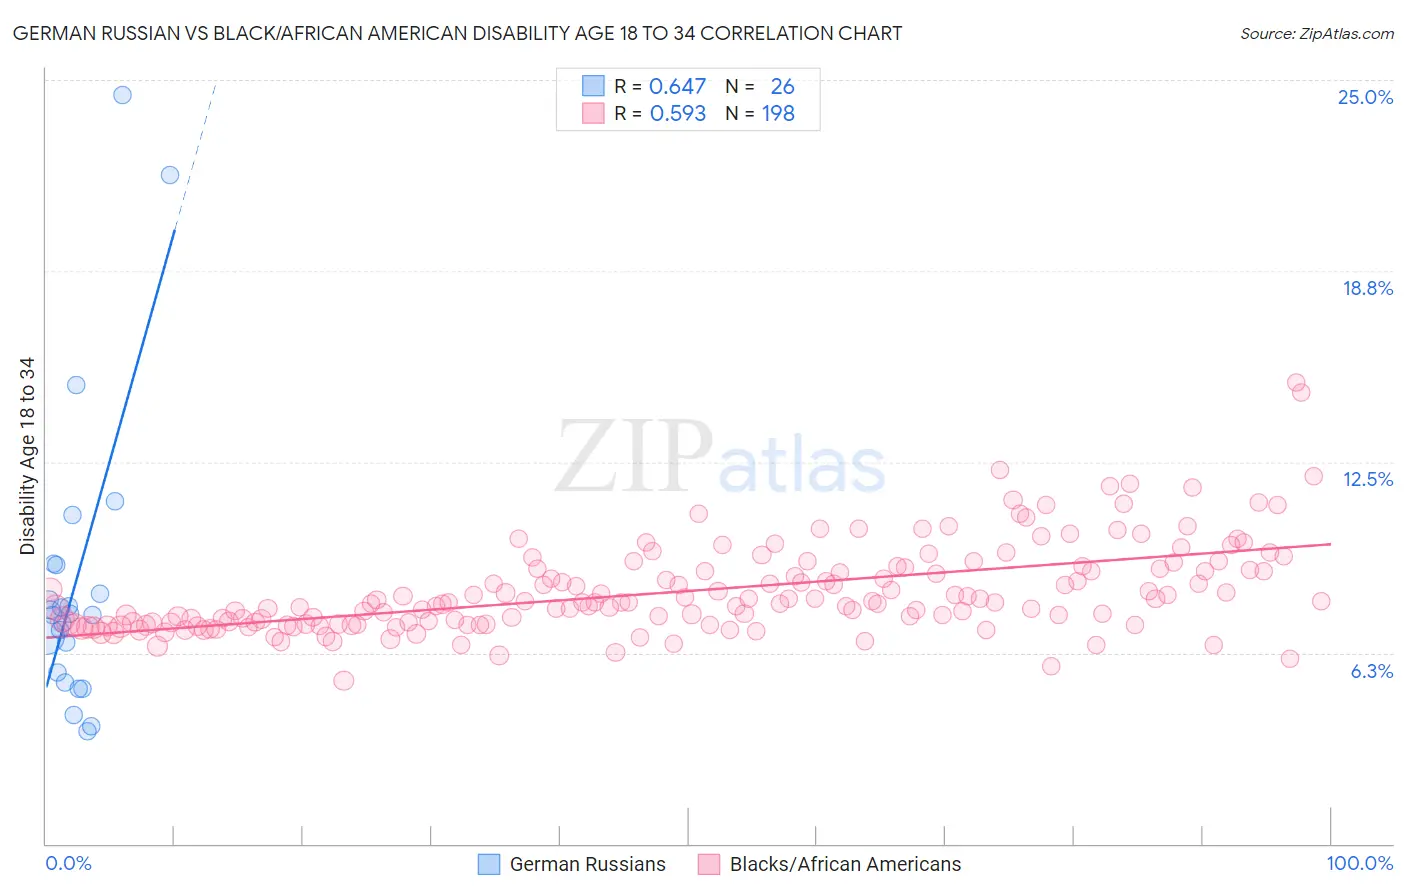
German Russian vs Black/African American Disability Age 18 to 34 Correlation Chart
The statistical analysis conducted on geographies consisting of 96,377,873 people shows a significant positive correlation between the proportion of German Russians and percentage of population with a disability between the ages 18 and 35 in the United States with a correlation coefficient (R) of 0.647 and weighted average of 7.4%. Similarly, the statistical analysis conducted on geographies consisting of 561,495,678 people shows a substantial positive correlation between the proportion of Blacks/African Americans and percentage of population with a disability between the ages 18 and 35 in the United States with a correlation coefficient (R) of 0.593 and weighted average of 7.7%, a difference of 4.3%.
Disability Age 18 to 34 Correlation Summary
| Measurement | German Russian | Black/African American |
| Minimum | 3.7% | 5.3% |
| Maximum | 24.5% | 15.1% |
| Range | 20.8% | 9.7% |
| Mean | 8.6% | 8.3% |
| Median | 7.5% | 7.9% |
| Interquartile 25% (IQ1) | 5.6% | 7.2% |
| Interquartile 75% (IQ3) | 9.1% | 9.0% |
| Interquartile Range (IQR) | 3.5% | 1.8% |
| Standard Deviation (Sample) | 4.9% | 1.5% |
| Standard Deviation (Population) | 4.9% | 1.5% |
Similar Demographics by Disability Age 18 to 34
Demographics Similar to German Russians by Disability Age 18 to 34
In terms of disability age 18 to 34, the demographic groups most similar to German Russians are Bangladeshi (7.4%, a difference of 0.060%), Portuguese (7.4%, a difference of 0.14%), Slovene (7.3%, a difference of 0.17%), Basque (7.4%, a difference of 0.18%), and Bermudan (7.3%, a difference of 0.19%).
| Demographics | Rating | Rank | Disability Age 18 to 34 |
| Somalis | 0.2 /100 | #259 | Tragic 7.3% |
| Tohono O'odham | 0.2 /100 | #260 | Tragic 7.3% |
| Northern Europeans | 0.2 /100 | #261 | Tragic 7.3% |
| Canadians | 0.2 /100 | #262 | Tragic 7.3% |
| British | 0.2 /100 | #263 | Tragic 7.3% |
| Bermudans | 0.1 /100 | #264 | Tragic 7.3% |
| Slovenes | 0.1 /100 | #265 | Tragic 7.3% |
| German Russians | 0.1 /100 | #266 | Tragic 7.4% |
| Bangladeshis | 0.1 /100 | #267 | Tragic 7.4% |
| Portuguese | 0.1 /100 | #268 | Tragic 7.4% |
| Basques | 0.1 /100 | #269 | Tragic 7.4% |
| Belgians | 0.1 /100 | #270 | Tragic 7.4% |
| Swiss | 0.1 /100 | #271 | Tragic 7.4% |
| Tsimshian | 0.1 /100 | #272 | Tragic 7.4% |
| Slavs | 0.1 /100 | #273 | Tragic 7.4% |
Demographics Similar to Blacks/African Americans by Disability Age 18 to 34
In terms of disability age 18 to 34, the demographic groups most similar to Blacks/African Americans are Scandinavian (7.7%, a difference of 0.060%), Immigrants from Cabo Verde (7.7%, a difference of 0.21%), Irish (7.7%, a difference of 0.22%), Tlingit-Haida (7.7%, a difference of 0.22%), and Slovak (7.7%, a difference of 0.27%).
| Demographics | Rating | Rank | Disability Age 18 to 34 |
| Swedes | 0.0 /100 | #285 | Tragic 7.5% |
| Celtics | 0.0 /100 | #286 | Tragic 7.6% |
| Norwegians | 0.0 /100 | #287 | Tragic 7.6% |
| Whites/Caucasians | 0.0 /100 | #288 | Tragic 7.6% |
| Immigrants | Nonimmigrants | 0.0 /100 | #289 | Tragic 7.6% |
| Slovaks | 0.0 /100 | #290 | Tragic 7.7% |
| Irish | 0.0 /100 | #291 | Tragic 7.7% |
| Blacks/African Americans | 0.0 /100 | #292 | Tragic 7.7% |
| Scandinavians | 0.0 /100 | #293 | Tragic 7.7% |
| Immigrants | Cabo Verde | 0.0 /100 | #294 | Tragic 7.7% |
| Tlingit-Haida | 0.0 /100 | #295 | Tragic 7.7% |
| Cape Verdeans | 0.0 /100 | #296 | Tragic 7.7% |
| Pueblo | 0.0 /100 | #297 | Tragic 7.7% |
| Dutch | 0.0 /100 | #298 | Tragic 7.7% |
| Germans | 0.0 /100 | #299 | Tragic 7.7% |