Yugoslavian vs Slavic Female Poverty Among 25-34 Year Olds
COMPARE
Yugoslavian
Slavic
Female Poverty Among 25-34 Year Olds
Female Poverty Among 25-34 Year Olds Comparison
Yugoslavians
Slavs
13.6%
FEMALE POVERTY AMONG 25-34 YEAR OLDS
45.0/ 100
METRIC RATING
176th/ 347
METRIC RANK
13.2%
FEMALE POVERTY AMONG 25-34 YEAR OLDS
75.7/ 100
METRIC RATING
152nd/ 347
METRIC RANK
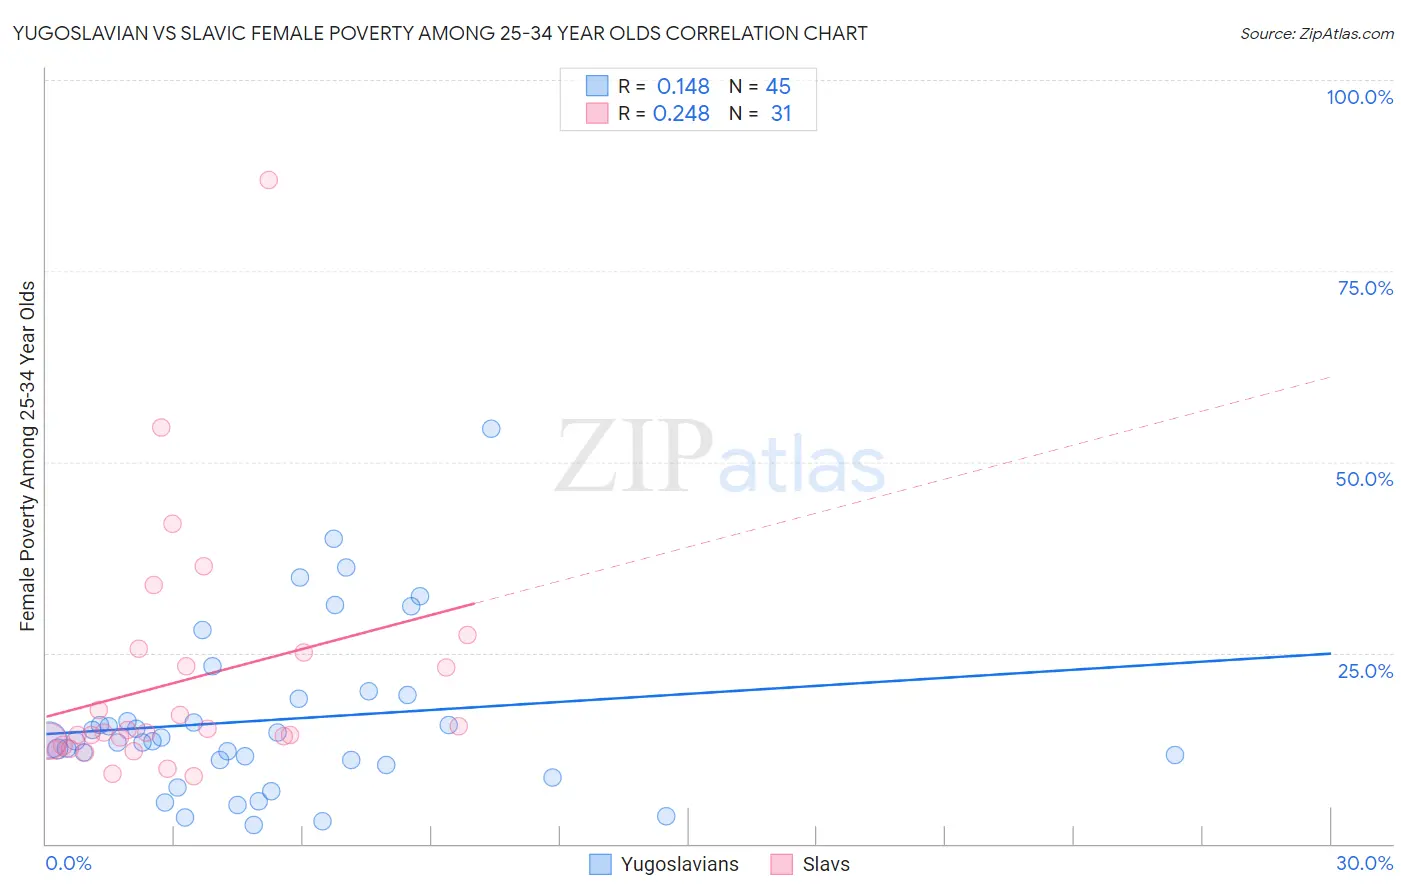
Yugoslavian vs Slavic Female Poverty Among 25-34 Year Olds Correlation Chart
The statistical analysis conducted on geographies consisting of 282,185,562 people shows a poor positive correlation between the proportion of Yugoslavians and poverty level among females between the ages 25 and 34 in the United States with a correlation coefficient (R) of 0.148 and weighted average of 13.6%. Similarly, the statistical analysis conducted on geographies consisting of 266,820,007 people shows a weak positive correlation between the proportion of Slavs and poverty level among females between the ages 25 and 34 in the United States with a correlation coefficient (R) of 0.248 and weighted average of 13.2%, a difference of 2.9%.
Female Poverty Among 25-34 Year Olds Correlation Summary
| Measurement | Yugoslavian | Slavic |
| Minimum | 2.5% | 8.9% |
| Maximum | 54.3% | 87.0% |
| Range | 51.8% | 78.1% |
| Mean | 16.2% | 21.3% |
| Median | 13.4% | 14.5% |
| Interquartile 25% (IQ1) | 10.6% | 12.9% |
| Interquartile 75% (IQ3) | 19.2% | 25.0% |
| Interquartile Range (IQR) | 8.6% | 12.1% |
| Standard Deviation (Sample) | 10.9% | 16.0% |
| Standard Deviation (Population) | 10.7% | 15.8% |
Similar Demographics by Female Poverty Among 25-34 Year Olds
Demographics Similar to Yugoslavians by Female Poverty Among 25-34 Year Olds
In terms of female poverty among 25-34 year olds, the demographic groups most similar to Yugoslavians are Venezuelan (13.6%, a difference of 0.030%), Canadian (13.6%, a difference of 0.060%), Immigrants from Eastern Africa (13.6%, a difference of 0.12%), Bermudan (13.6%, a difference of 0.15%), and German (13.6%, a difference of 0.29%).
| Demographics | Rating | Rank | Female Poverty Among 25-34 Year Olds |
| Samoans | 56.8 /100 | #169 | Average 13.5% |
| Immigrants | Uganda | 53.0 /100 | #170 | Average 13.5% |
| South American Indians | 51.9 /100 | #171 | Average 13.5% |
| Immigrants | Costa Rica | 51.9 /100 | #172 | Average 13.5% |
| Kenyans | 51.8 /100 | #173 | Average 13.5% |
| Immigrants | Oceania | 50.0 /100 | #174 | Average 13.5% |
| Bermudans | 46.8 /100 | #175 | Average 13.6% |
| Yugoslavians | 45.0 /100 | #176 | Average 13.6% |
| Venezuelans | 44.6 /100 | #177 | Average 13.6% |
| Canadians | 44.3 /100 | #178 | Average 13.6% |
| Immigrants | Eastern Africa | 43.6 /100 | #179 | Average 13.6% |
| Germans | 41.6 /100 | #180 | Average 13.6% |
| Guamanians/Chamorros | 41.5 /100 | #181 | Average 13.6% |
| Immigrants | Venezuela | 40.7 /100 | #182 | Average 13.6% |
| Portuguese | 40.3 /100 | #183 | Average 13.6% |
Demographics Similar to Slavs by Female Poverty Among 25-34 Year Olds
In terms of female poverty among 25-34 year olds, the demographic groups most similar to Slavs are Costa Rican (13.2%, a difference of 0.010%), Iraqi (13.2%, a difference of 0.040%), Sierra Leonean (13.2%, a difference of 0.060%), European (13.2%, a difference of 0.13%), and Lebanese (13.2%, a difference of 0.13%).
| Demographics | Rating | Rank | Female Poverty Among 25-34 Year Olds |
| Colombians | 77.2 /100 | #145 | Good 13.2% |
| South Americans | 76.9 /100 | #146 | Good 13.2% |
| Europeans | 76.8 /100 | #147 | Good 13.2% |
| Lebanese | 76.8 /100 | #148 | Good 13.2% |
| Sierra Leoneans | 76.3 /100 | #149 | Good 13.2% |
| Iraqis | 76.0 /100 | #150 | Good 13.2% |
| Costa Ricans | 75.8 /100 | #151 | Good 13.2% |
| Slavs | 75.7 /100 | #152 | Good 13.2% |
| Northern Europeans | 73.7 /100 | #153 | Good 13.2% |
| Arabs | 73.5 /100 | #154 | Good 13.2% |
| Immigrants | Sierra Leone | 72.9 /100 | #155 | Good 13.3% |
| Immigrants | Cameroon | 72.0 /100 | #156 | Good 13.3% |
| Immigrants | Western Europe | 70.3 /100 | #157 | Good 13.3% |
| Immigrants | Colombia | 69.2 /100 | #158 | Good 13.3% |
| Uruguayans | 66.9 /100 | #159 | Good 13.3% |