European vs Uruguayan Female Poverty
COMPARE
European
Uruguayan
Female Poverty
Female Poverty Comparison
Europeans
Uruguayans
12.3%
FEMALE POVERTY
97.4/ 100
METRIC RATING
75th/ 347
METRIC RANK
13.6%
FEMALE POVERTY
39.8/ 100
METRIC RATING
189th/ 347
METRIC RANK
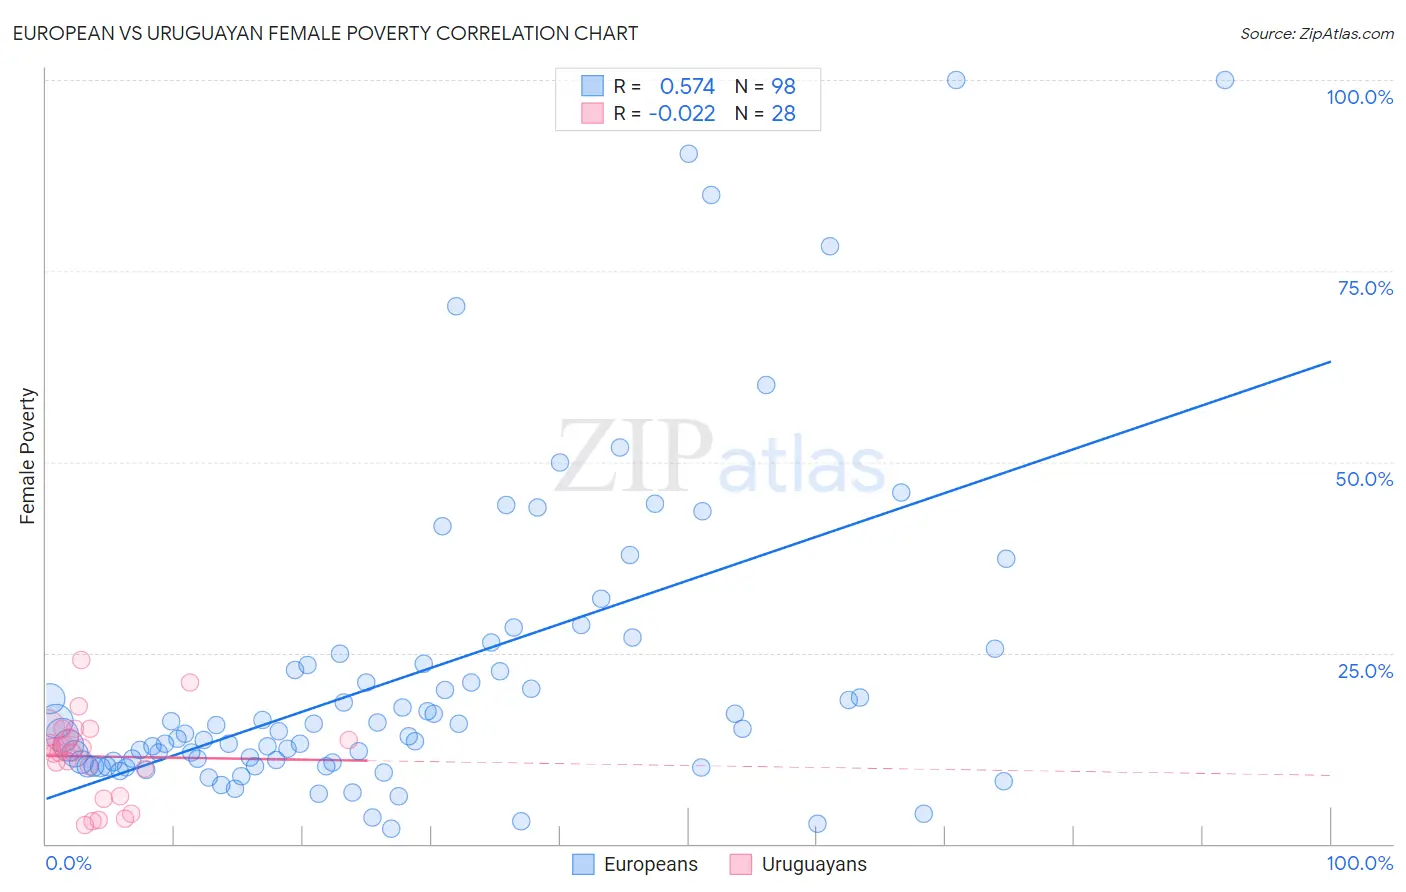
European vs Uruguayan Female Poverty Correlation Chart
The statistical analysis conducted on geographies consisting of 560,757,214 people shows a substantial positive correlation between the proportion of Europeans and poverty level among females in the United States with a correlation coefficient (R) of 0.574 and weighted average of 12.3%. Similarly, the statistical analysis conducted on geographies consisting of 144,759,999 people shows no correlation between the proportion of Uruguayans and poverty level among females in the United States with a correlation coefficient (R) of -0.022 and weighted average of 13.6%, a difference of 10.6%.
Female Poverty Correlation Summary
| Measurement | European | Uruguayan |
| Minimum | 1.9% | 2.5% |
| Maximum | 100.0% | 24.1% |
| Range | 98.1% | 21.6% |
| Mean | 22.2% | 11.4% |
| Median | 14.5% | 12.3% |
| Interquartile 25% (IQ1) | 10.7% | 8.0% |
| Interquartile 75% (IQ3) | 23.6% | 14.4% |
| Interquartile Range (IQR) | 12.9% | 6.5% |
| Standard Deviation (Sample) | 20.6% | 5.4% |
| Standard Deviation (Population) | 20.5% | 5.3% |
Similar Demographics by Female Poverty
Demographics Similar to Europeans by Female Poverty
In terms of female poverty, the demographic groups most similar to Europeans are Immigrants from Canada (12.3%, a difference of 0.12%), Zimbabwean (12.3%, a difference of 0.13%), Cambodian (12.2%, a difference of 0.15%), Immigrants from Eastern Europe (12.3%, a difference of 0.17%), and Carpatho Rusyn (12.2%, a difference of 0.18%).
| Demographics | Rating | Rank | Female Poverty |
| Immigrants | Netherlands | 97.8 /100 | #68 | Exceptional 12.2% |
| Swiss | 97.7 /100 | #69 | Exceptional 12.2% |
| Immigrants | Belgium | 97.7 /100 | #70 | Exceptional 12.2% |
| Carpatho Rusyns | 97.6 /100 | #71 | Exceptional 12.2% |
| Cambodians | 97.5 /100 | #72 | Exceptional 12.2% |
| Zimbabweans | 97.5 /100 | #73 | Exceptional 12.3% |
| Immigrants | Canada | 97.5 /100 | #74 | Exceptional 12.3% |
| Europeans | 97.4 /100 | #75 | Exceptional 12.3% |
| Immigrants | Eastern Europe | 97.2 /100 | #76 | Exceptional 12.3% |
| Serbians | 97.2 /100 | #77 | Exceptional 12.3% |
| Egyptians | 97.2 /100 | #78 | Exceptional 12.3% |
| Immigrants | North America | 97.1 /100 | #79 | Exceptional 12.3% |
| Slovaks | 97.1 /100 | #80 | Exceptional 12.3% |
| Immigrants | Sweden | 97.1 /100 | #81 | Exceptional 12.3% |
| Jordanians | 97.1 /100 | #82 | Exceptional 12.3% |
Demographics Similar to Uruguayans by Female Poverty
In terms of female poverty, the demographic groups most similar to Uruguayans are Hawaiian (13.6%, a difference of 0.010%), Immigrants from Venezuela (13.6%, a difference of 0.11%), Immigrants from Portugal (13.6%, a difference of 0.17%), Immigrants from Cameroon (13.5%, a difference of 0.22%), and Immigrants from Sierra Leone (13.5%, a difference of 0.33%).
| Demographics | Rating | Rank | Female Poverty |
| Immigrants | Colombia | 44.5 /100 | #182 | Average 13.5% |
| Kenyans | 43.8 /100 | #183 | Average 13.5% |
| Immigrants | Sierra Leone | 43.2 /100 | #184 | Average 13.5% |
| Immigrants | Cameroon | 42.0 /100 | #185 | Average 13.5% |
| Immigrants | Portugal | 41.5 /100 | #186 | Average 13.6% |
| Immigrants | Venezuela | 41.0 /100 | #187 | Average 13.6% |
| Hawaiians | 39.9 /100 | #188 | Fair 13.6% |
| Uruguayans | 39.8 /100 | #189 | Fair 13.6% |
| Sierra Leoneans | 33.1 /100 | #190 | Fair 13.7% |
| Immigrants | Kuwait | 32.7 /100 | #191 | Fair 13.7% |
| Immigrants | Costa Rica | 31.9 /100 | #192 | Fair 13.7% |
| Iraqis | 31.8 /100 | #193 | Fair 13.7% |
| Delaware | 31.1 /100 | #194 | Fair 13.7% |
| Immigrants | South America | 30.6 /100 | #195 | Fair 13.7% |
| South American Indians | 28.9 /100 | #196 | Fair 13.7% |