Immigrants from Pakistan vs Uruguayan Female Poverty
COMPARE
Immigrants from Pakistan
Uruguayan
Female Poverty
Female Poverty Comparison
Immigrants from Pakistan
Uruguayans
11.8%
FEMALE POVERTY
99.4/ 100
METRIC RATING
36th/ 347
METRIC RANK
13.6%
FEMALE POVERTY
39.8/ 100
METRIC RATING
189th/ 347
METRIC RANK
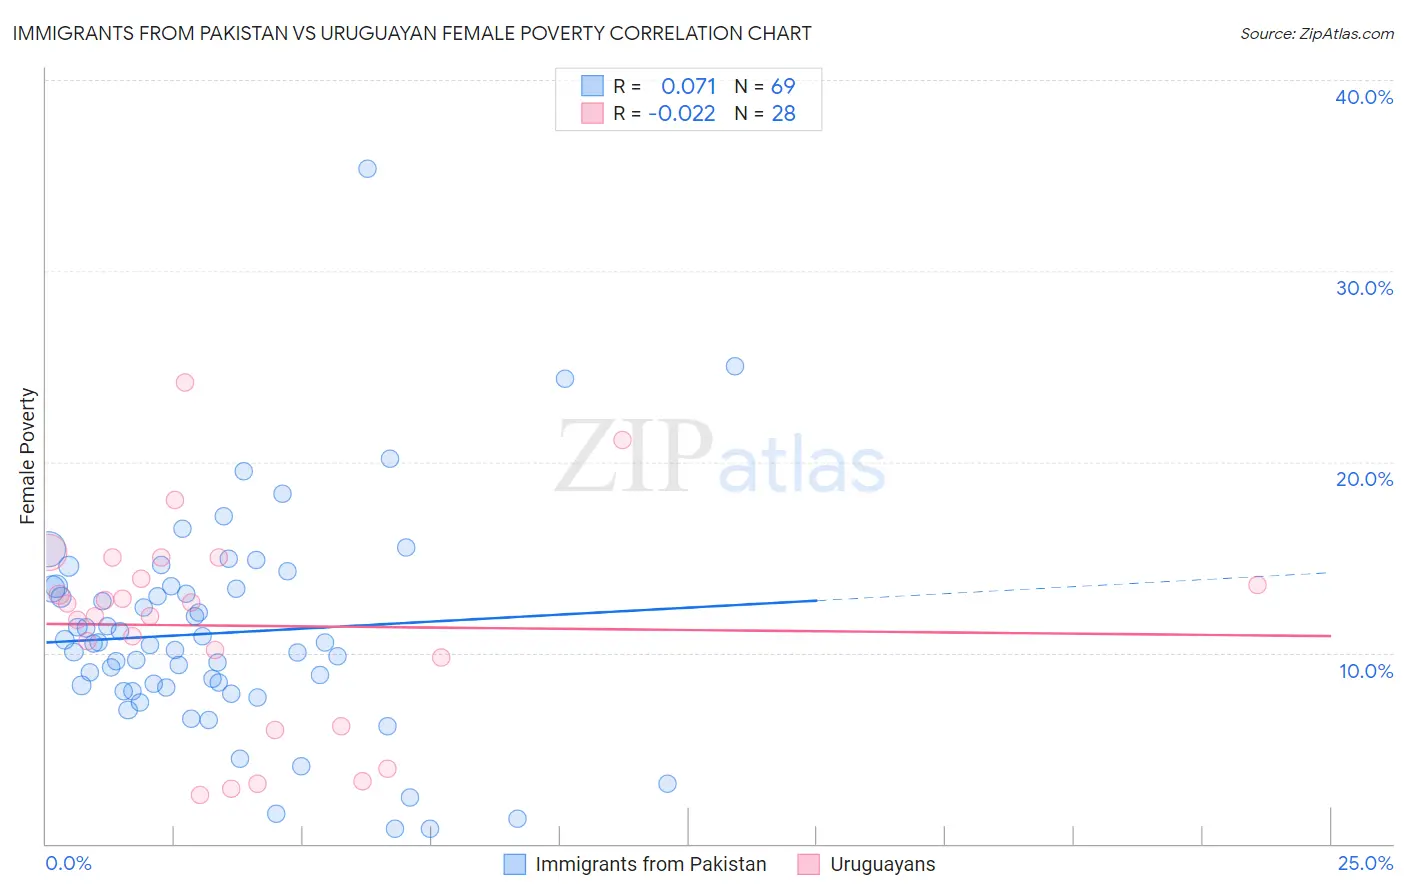
Immigrants from Pakistan vs Uruguayan Female Poverty Correlation Chart
The statistical analysis conducted on geographies consisting of 283,777,836 people shows a slight positive correlation between the proportion of Immigrants from Pakistan and poverty level among females in the United States with a correlation coefficient (R) of 0.071 and weighted average of 11.8%. Similarly, the statistical analysis conducted on geographies consisting of 144,759,999 people shows no correlation between the proportion of Uruguayans and poverty level among females in the United States with a correlation coefficient (R) of -0.022 and weighted average of 13.6%, a difference of 15.0%.
Female Poverty Correlation Summary
| Measurement | Immigrants from Pakistan | Uruguayan |
| Minimum | 0.75% | 2.5% |
| Maximum | 35.3% | 24.1% |
| Range | 34.6% | 21.6% |
| Mean | 11.0% | 11.4% |
| Median | 10.5% | 12.3% |
| Interquartile 25% (IQ1) | 8.1% | 8.0% |
| Interquartile 75% (IQ3) | 13.4% | 14.4% |
| Interquartile Range (IQR) | 5.3% | 6.5% |
| Standard Deviation (Sample) | 5.7% | 5.4% |
| Standard Deviation (Population) | 5.6% | 5.3% |
Similar Demographics by Female Poverty
Demographics Similar to Immigrants from Pakistan by Female Poverty
In terms of female poverty, the demographic groups most similar to Immigrants from Pakistan are Immigrants from Greece (11.8%, a difference of 0.10%), Russian (11.8%, a difference of 0.11%), Immigrants from Iran (11.8%, a difference of 0.17%), Immigrants from Poland (11.8%, a difference of 0.32%), and Immigrants from Singapore (11.8%, a difference of 0.34%).
| Demographics | Rating | Rank | Female Poverty |
| Immigrants | North Macedonia | 99.6 /100 | #29 | Exceptional 11.7% |
| Greeks | 99.5 /100 | #30 | Exceptional 11.7% |
| Poles | 99.5 /100 | #31 | Exceptional 11.7% |
| Danes | 99.5 /100 | #32 | Exceptional 11.7% |
| Cypriots | 99.5 /100 | #33 | Exceptional 11.8% |
| Immigrants | Singapore | 99.4 /100 | #34 | Exceptional 11.8% |
| Immigrants | Iran | 99.4 /100 | #35 | Exceptional 11.8% |
| Immigrants | Pakistan | 99.4 /100 | #36 | Exceptional 11.8% |
| Immigrants | Greece | 99.3 /100 | #37 | Exceptional 11.8% |
| Russians | 99.3 /100 | #38 | Exceptional 11.8% |
| Immigrants | Poland | 99.3 /100 | #39 | Exceptional 11.8% |
| Macedonians | 99.3 /100 | #40 | Exceptional 11.8% |
| Czechs | 99.2 /100 | #41 | Exceptional 11.9% |
| Immigrants | Moldova | 99.2 /100 | #42 | Exceptional 11.9% |
| Koreans | 99.2 /100 | #43 | Exceptional 11.9% |
Demographics Similar to Uruguayans by Female Poverty
In terms of female poverty, the demographic groups most similar to Uruguayans are Hawaiian (13.6%, a difference of 0.010%), Immigrants from Venezuela (13.6%, a difference of 0.11%), Immigrants from Portugal (13.6%, a difference of 0.17%), Immigrants from Cameroon (13.5%, a difference of 0.22%), and Immigrants from Sierra Leone (13.5%, a difference of 0.33%).
| Demographics | Rating | Rank | Female Poverty |
| Immigrants | Colombia | 44.5 /100 | #182 | Average 13.5% |
| Kenyans | 43.8 /100 | #183 | Average 13.5% |
| Immigrants | Sierra Leone | 43.2 /100 | #184 | Average 13.5% |
| Immigrants | Cameroon | 42.0 /100 | #185 | Average 13.5% |
| Immigrants | Portugal | 41.5 /100 | #186 | Average 13.6% |
| Immigrants | Venezuela | 41.0 /100 | #187 | Average 13.6% |
| Hawaiians | 39.9 /100 | #188 | Fair 13.6% |
| Uruguayans | 39.8 /100 | #189 | Fair 13.6% |
| Sierra Leoneans | 33.1 /100 | #190 | Fair 13.7% |
| Immigrants | Kuwait | 32.7 /100 | #191 | Fair 13.7% |
| Immigrants | Costa Rica | 31.9 /100 | #192 | Fair 13.7% |
| Iraqis | 31.8 /100 | #193 | Fair 13.7% |
| Delaware | 31.1 /100 | #194 | Fair 13.7% |
| Immigrants | South America | 30.6 /100 | #195 | Fair 13.7% |
| South American Indians | 28.9 /100 | #196 | Fair 13.7% |