European vs Immigrants from North Macedonia Child Poverty Under the Age of 5
COMPARE
European
Immigrants from North Macedonia
Child Poverty Under the Age of 5
Child Poverty Under the Age of 5 Comparison
Europeans
Immigrants from North Macedonia
15.9%
CHILD POVERTY UNDER THE AGE OF 5
95.3/ 100
METRIC RATING
103rd/ 347
METRIC RANK
16.4%
CHILD POVERTY UNDER THE AGE OF 5
87.8/ 100
METRIC RATING
134th/ 347
METRIC RANK
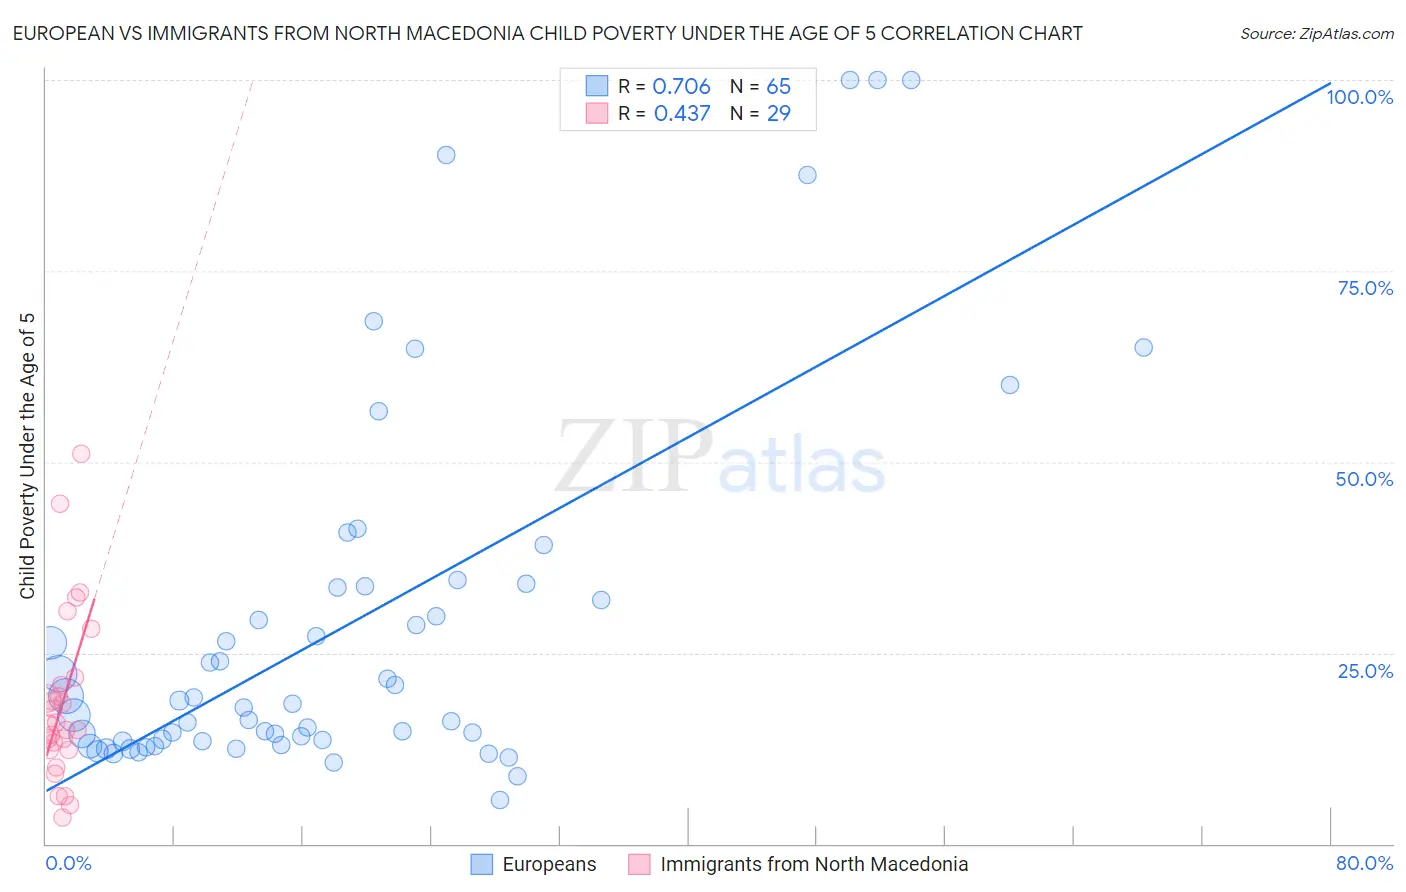
European vs Immigrants from North Macedonia Child Poverty Under the Age of 5 Correlation Chart
The statistical analysis conducted on geographies consisting of 523,525,601 people shows a strong positive correlation between the proportion of Europeans and poverty level among children under the age of 5 in the United States with a correlation coefficient (R) of 0.706 and weighted average of 15.9%. Similarly, the statistical analysis conducted on geographies consisting of 72,663,175 people shows a moderate positive correlation between the proportion of Immigrants from North Macedonia and poverty level among children under the age of 5 in the United States with a correlation coefficient (R) of 0.437 and weighted average of 16.4%, a difference of 2.9%.
Child Poverty Under the Age of 5 Correlation Summary
| Measurement | European | Immigrants from North Macedonia |
| Minimum | 5.7% | 3.4% |
| Maximum | 100.0% | 51.0% |
| Range | 94.3% | 47.6% |
| Mean | 28.7% | 18.5% |
| Median | 18.3% | 15.8% |
| Interquartile 25% (IQ1) | 13.5% | 12.3% |
| Interquartile 75% (IQ3) | 33.6% | 21.3% |
| Interquartile Range (IQR) | 20.1% | 9.0% |
| Standard Deviation (Sample) | 24.2% | 11.1% |
| Standard Deviation (Population) | 24.0% | 10.9% |
Similar Demographics by Child Poverty Under the Age of 5
Demographics Similar to Europeans by Child Poverty Under the Age of 5
In terms of child poverty under the age of 5, the demographic groups most similar to Europeans are Immigrants from North America (15.9%, a difference of 0.21%), Armenian (15.8%, a difference of 0.28%), Immigrants from Spain (15.9%, a difference of 0.28%), Tlingit-Haida (15.9%, a difference of 0.33%), and Immigrants from Zimbabwe (15.8%, a difference of 0.41%).
| Demographics | Rating | Rank | Child Poverty Under the Age of 5 |
| Immigrants | Kazakhstan | 96.2 /100 | #96 | Exceptional 15.8% |
| Macedonians | 96.2 /100 | #97 | Exceptional 15.8% |
| Immigrants | South Africa | 96.1 /100 | #98 | Exceptional 15.8% |
| Palestinians | 95.9 /100 | #99 | Exceptional 15.8% |
| Immigrants | Canada | 95.9 /100 | #100 | Exceptional 15.8% |
| Immigrants | Zimbabwe | 95.9 /100 | #101 | Exceptional 15.8% |
| Armenians | 95.7 /100 | #102 | Exceptional 15.8% |
| Europeans | 95.3 /100 | #103 | Exceptional 15.9% |
| Immigrants | North America | 94.9 /100 | #104 | Exceptional 15.9% |
| Immigrants | Spain | 94.8 /100 | #105 | Exceptional 15.9% |
| Tlingit-Haida | 94.7 /100 | #106 | Exceptional 15.9% |
| Slovenes | 94.4 /100 | #107 | Exceptional 16.0% |
| Immigrants | Brazil | 94.4 /100 | #108 | Exceptional 16.0% |
| Northern Europeans | 94.3 /100 | #109 | Exceptional 16.0% |
| Romanians | 94.3 /100 | #110 | Exceptional 16.0% |
Demographics Similar to Immigrants from North Macedonia by Child Poverty Under the Age of 5
In terms of child poverty under the age of 5, the demographic groups most similar to Immigrants from North Macedonia are Brazilian (16.4%, a difference of 0.010%), Icelander (16.3%, a difference of 0.020%), Immigrants from Northern Africa (16.4%, a difference of 0.070%), Serbian (16.3%, a difference of 0.090%), and Finnish (16.3%, a difference of 0.12%).
| Demographics | Rating | Rank | Child Poverty Under the Age of 5 |
| Immigrants | England | 91.5 /100 | #127 | Exceptional 16.2% |
| South Africans | 90.1 /100 | #128 | Exceptional 16.2% |
| British | 89.4 /100 | #129 | Excellent 16.3% |
| Immigrants | Norway | 89.3 /100 | #130 | Excellent 16.3% |
| Finns | 88.3 /100 | #131 | Excellent 16.3% |
| Serbians | 88.2 /100 | #132 | Excellent 16.3% |
| Icelanders | 87.9 /100 | #133 | Excellent 16.3% |
| Immigrants | North Macedonia | 87.8 /100 | #134 | Excellent 16.4% |
| Brazilians | 87.8 /100 | #135 | Excellent 16.4% |
| Immigrants | Northern Africa | 87.5 /100 | #136 | Excellent 16.4% |
| Immigrants | Chile | 85.3 /100 | #137 | Excellent 16.4% |
| Germans | 84.8 /100 | #138 | Excellent 16.5% |
| Immigrants | Hungary | 84.5 /100 | #139 | Excellent 16.5% |
| Guamanians/Chamorros | 84.2 /100 | #140 | Excellent 16.5% |
| Immigrants | Western Europe | 83.3 /100 | #141 | Excellent 16.5% |