European vs Austrian Child Poverty Under the Age of 5
COMPARE
European
Austrian
Child Poverty Under the Age of 5
Child Poverty Under the Age of 5 Comparison
Europeans
Austrians
15.9%
CHILD POVERTY UNDER THE AGE OF 5
95.3/ 100
METRIC RATING
103rd/ 347
METRIC RANK
16.1%
CHILD POVERTY UNDER THE AGE OF 5
92.0/ 100
METRIC RATING
123rd/ 347
METRIC RANK
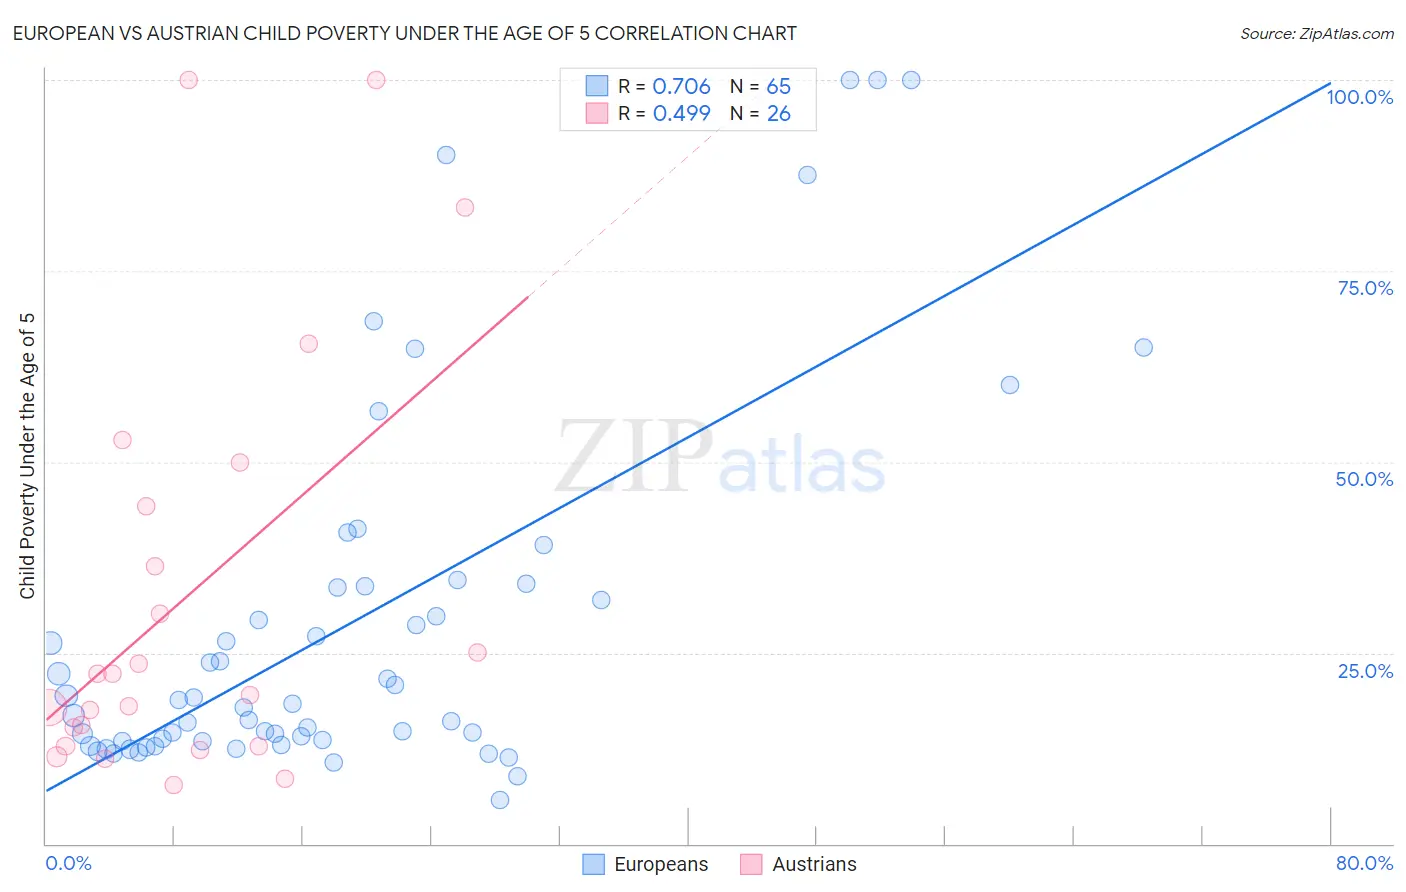
European vs Austrian Child Poverty Under the Age of 5 Correlation Chart
The statistical analysis conducted on geographies consisting of 523,525,601 people shows a strong positive correlation between the proportion of Europeans and poverty level among children under the age of 5 in the United States with a correlation coefficient (R) of 0.706 and weighted average of 15.9%. Similarly, the statistical analysis conducted on geographies consisting of 426,879,815 people shows a moderate positive correlation between the proportion of Austrians and poverty level among children under the age of 5 in the United States with a correlation coefficient (R) of 0.499 and weighted average of 16.1%, a difference of 1.6%.
Child Poverty Under the Age of 5 Correlation Summary
| Measurement | European | Austrian |
| Minimum | 5.7% | 7.7% |
| Maximum | 100.0% | 100.0% |
| Range | 94.3% | 92.3% |
| Mean | 28.7% | 32.1% |
| Median | 18.3% | 20.8% |
| Interquartile 25% (IQ1) | 13.5% | 12.8% |
| Interquartile 75% (IQ3) | 33.6% | 44.1% |
| Interquartile Range (IQR) | 20.1% | 31.3% |
| Standard Deviation (Sample) | 24.2% | 27.3% |
| Standard Deviation (Population) | 24.0% | 26.8% |
Demographics Similar to Europeans and Austrians by Child Poverty Under the Age of 5
In terms of child poverty under the age of 5, the demographic groups most similar to Europeans are Immigrants from North America (15.9%, a difference of 0.21%), Immigrants from Spain (15.9%, a difference of 0.28%), Tlingit-Haida (15.9%, a difference of 0.33%), Slovene (16.0%, a difference of 0.48%), and Immigrants from Brazil (16.0%, a difference of 0.49%). Similarly, the demographic groups most similar to Austrians are Immigrants from Southern Europe (16.1%, a difference of 0.030%), Mongolian (16.1%, a difference of 0.22%), Immigrants from Peru (16.1%, a difference of 0.23%), Immigrants from Jordan (16.1%, a difference of 0.49%), and Basque (16.0%, a difference of 0.61%).
| Demographics | Rating | Rank | Child Poverty Under the Age of 5 |
| Europeans | 95.3 /100 | #103 | Exceptional 15.9% |
| Immigrants | North America | 94.9 /100 | #104 | Exceptional 15.9% |
| Immigrants | Spain | 94.8 /100 | #105 | Exceptional 15.9% |
| Tlingit-Haida | 94.7 /100 | #106 | Exceptional 15.9% |
| Slovenes | 94.4 /100 | #107 | Exceptional 16.0% |
| Immigrants | Brazil | 94.4 /100 | #108 | Exceptional 16.0% |
| Northern Europeans | 94.3 /100 | #109 | Exceptional 16.0% |
| Romanians | 94.3 /100 | #110 | Exceptional 16.0% |
| Pakistanis | 94.2 /100 | #111 | Exceptional 16.0% |
| Peruvians | 94.1 /100 | #112 | Exceptional 16.0% |
| Puget Sound Salish | 94.1 /100 | #113 | Exceptional 16.0% |
| Immigrants | Kuwait | 93.9 /100 | #114 | Exceptional 16.0% |
| Albanians | 93.8 /100 | #115 | Exceptional 16.0% |
| Immigrants | Austria | 93.5 /100 | #116 | Exceptional 16.0% |
| Basques | 93.4 /100 | #117 | Exceptional 16.0% |
| Immigrants | Denmark | 93.4 /100 | #118 | Exceptional 16.0% |
| Immigrants | Jordan | 93.2 /100 | #119 | Exceptional 16.1% |
| Immigrants | Peru | 92.6 /100 | #120 | Exceptional 16.1% |
| Mongolians | 92.5 /100 | #121 | Exceptional 16.1% |
| Immigrants | Southern Europe | 92.0 /100 | #122 | Exceptional 16.1% |
| Austrians | 92.0 /100 | #123 | Exceptional 16.1% |