Egyptian vs Tlingit-Haida Single Mother Poverty
COMPARE
Egyptian
Tlingit-Haida
Single Mother Poverty
Single Mother Poverty Comparison
Egyptians
Tlingit-Haida
26.9%
SINGLE MOTHER POVERTY
99.8/ 100
METRIC RATING
47th/ 347
METRIC RANK
30.9%
SINGLE MOTHER POVERTY
0.6/ 100
METRIC RATING
251st/ 347
METRIC RANK
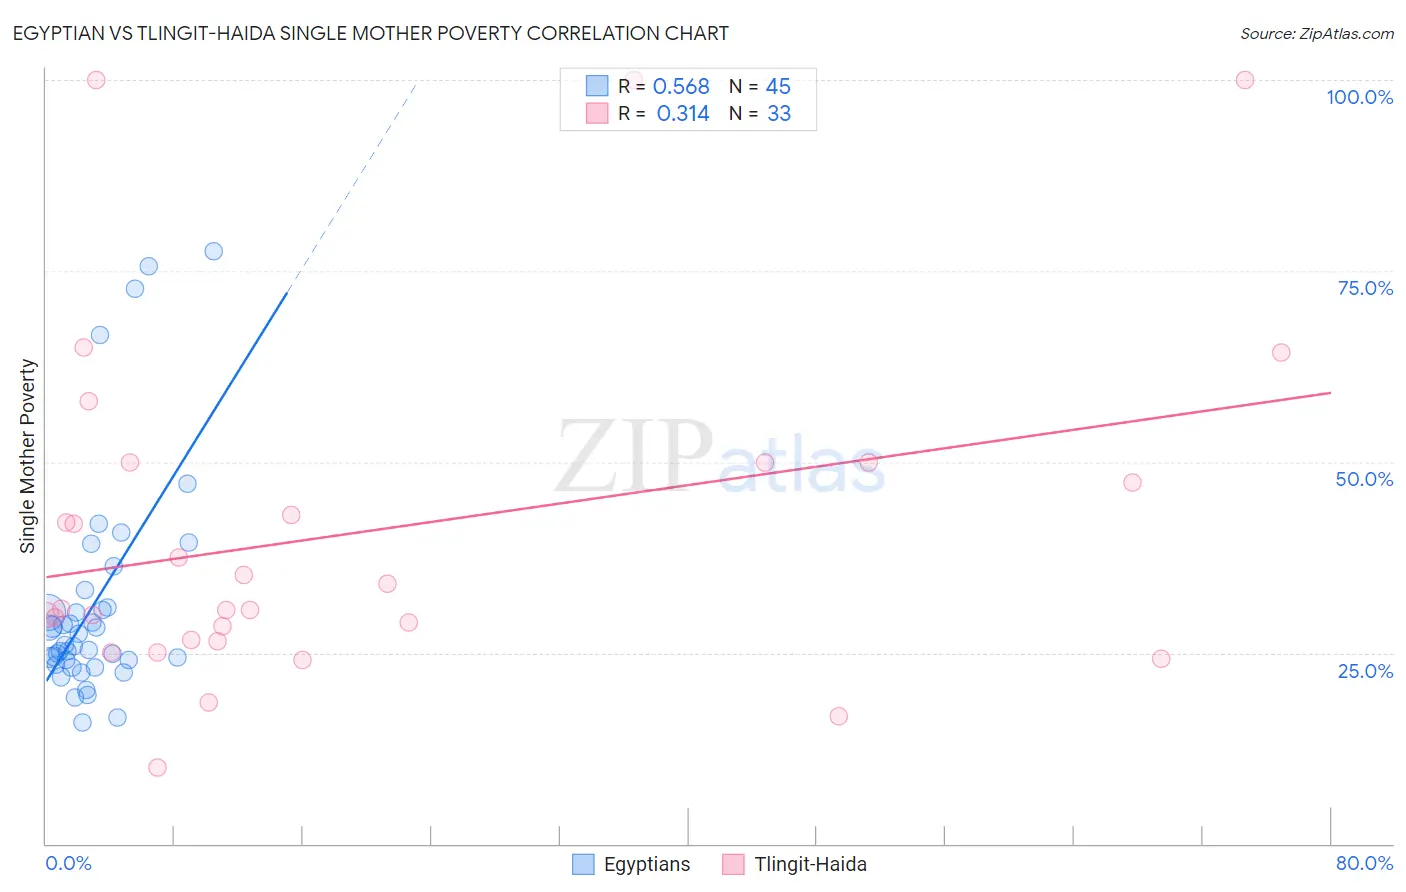
Egyptian vs Tlingit-Haida Single Mother Poverty Correlation Chart
The statistical analysis conducted on geographies consisting of 271,623,906 people shows a substantial positive correlation between the proportion of Egyptians and poverty level among single mothers in the United States with a correlation coefficient (R) of 0.568 and weighted average of 26.9%. Similarly, the statistical analysis conducted on geographies consisting of 60,327,973 people shows a mild positive correlation between the proportion of Tlingit-Haida and poverty level among single mothers in the United States with a correlation coefficient (R) of 0.314 and weighted average of 30.9%, a difference of 14.9%.
Single Mother Poverty Correlation Summary
| Measurement | Egyptian | Tlingit-Haida |
| Minimum | 15.9% | 10.0% |
| Maximum | 77.6% | 100.0% |
| Range | 61.7% | 90.0% |
| Mean | 31.5% | 41.0% |
| Median | 26.1% | 30.7% |
| Interquartile 25% (IQ1) | 23.8% | 26.6% |
| Interquartile 75% (IQ3) | 32.1% | 50.0% |
| Interquartile Range (IQR) | 8.3% | 23.4% |
| Standard Deviation (Sample) | 14.7% | 22.9% |
| Standard Deviation (Population) | 14.6% | 22.6% |
Similar Demographics by Single Mother Poverty
Demographics Similar to Egyptians by Single Mother Poverty
In terms of single mother poverty, the demographic groups most similar to Egyptians are Immigrants from Serbia (26.9%, a difference of 0.060%), Immigrants from Poland (26.9%, a difference of 0.080%), Latvian (26.9%, a difference of 0.10%), Cambodian (27.0%, a difference of 0.16%), and Laotian (27.0%, a difference of 0.17%).
| Demographics | Rating | Rank | Single Mother Poverty |
| Immigrants | Vietnam | 99.9 /100 | #40 | Exceptional 26.7% |
| Immigrants | Greece | 99.9 /100 | #41 | Exceptional 26.7% |
| Armenians | 99.9 /100 | #42 | Exceptional 26.8% |
| Tsimshian | 99.9 /100 | #43 | Exceptional 26.8% |
| Immigrants | Sierra Leone | 99.9 /100 | #44 | Exceptional 26.9% |
| Latvians | 99.9 /100 | #45 | Exceptional 26.9% |
| Immigrants | Serbia | 99.9 /100 | #46 | Exceptional 26.9% |
| Egyptians | 99.8 /100 | #47 | Exceptional 26.9% |
| Immigrants | Poland | 99.8 /100 | #48 | Exceptional 26.9% |
| Cambodians | 99.8 /100 | #49 | Exceptional 27.0% |
| Laotians | 99.8 /100 | #50 | Exceptional 27.0% |
| Immigrants | Argentina | 99.7 /100 | #51 | Exceptional 27.1% |
| Immigrants | South Eastern Asia | 99.7 /100 | #52 | Exceptional 27.1% |
| Immigrants | Jordan | 99.7 /100 | #53 | Exceptional 27.1% |
| Immigrants | Bulgaria | 99.7 /100 | #54 | Exceptional 27.1% |
Demographics Similar to Tlingit-Haida by Single Mother Poverty
In terms of single mother poverty, the demographic groups most similar to Tlingit-Haida are Alaska Native (30.9%, a difference of 0.010%), Celtic (30.9%, a difference of 0.040%), Vietnamese (30.9%, a difference of 0.12%), Senegalese (31.0%, a difference of 0.18%), and Cape Verdean (30.8%, a difference of 0.27%).
| Demographics | Rating | Rank | Single Mother Poverty |
| French | 1.3 /100 | #244 | Tragic 30.7% |
| Barbadians | 1.3 /100 | #245 | Tragic 30.7% |
| Ecuadorians | 0.9 /100 | #246 | Tragic 30.8% |
| West Indians | 0.9 /100 | #247 | Tragic 30.8% |
| French Canadians | 0.9 /100 | #248 | Tragic 30.8% |
| Cape Verdeans | 0.8 /100 | #249 | Tragic 30.8% |
| Vietnamese | 0.7 /100 | #250 | Tragic 30.9% |
| Tlingit-Haida | 0.6 /100 | #251 | Tragic 30.9% |
| Alaska Natives | 0.6 /100 | #252 | Tragic 30.9% |
| Celtics | 0.6 /100 | #253 | Tragic 30.9% |
| Senegalese | 0.5 /100 | #254 | Tragic 31.0% |
| Belizeans | 0.5 /100 | #255 | Tragic 31.0% |
| Immigrants | West Indies | 0.4 /100 | #256 | Tragic 31.1% |
| Immigrants | Bahamas | 0.4 /100 | #257 | Tragic 31.1% |
| Immigrants | Caribbean | 0.4 /100 | #258 | Tragic 31.1% |