Central American vs Lumbee Child Poverty Among Boys Under 16
COMPARE
Central American
Lumbee
Child Poverty Among Boys Under 16
Child Poverty Among Boys Under 16 Comparison
Central Americans
Lumbee
20.1%
CHILD POVERTY AMONG BOYS UNDER 16
0.0/ 100
METRIC RATING
280th/ 347
METRIC RANK
31.9%
CHILD POVERTY AMONG BOYS UNDER 16
0.0/ 100
METRIC RATING
346th/ 347
METRIC RANK
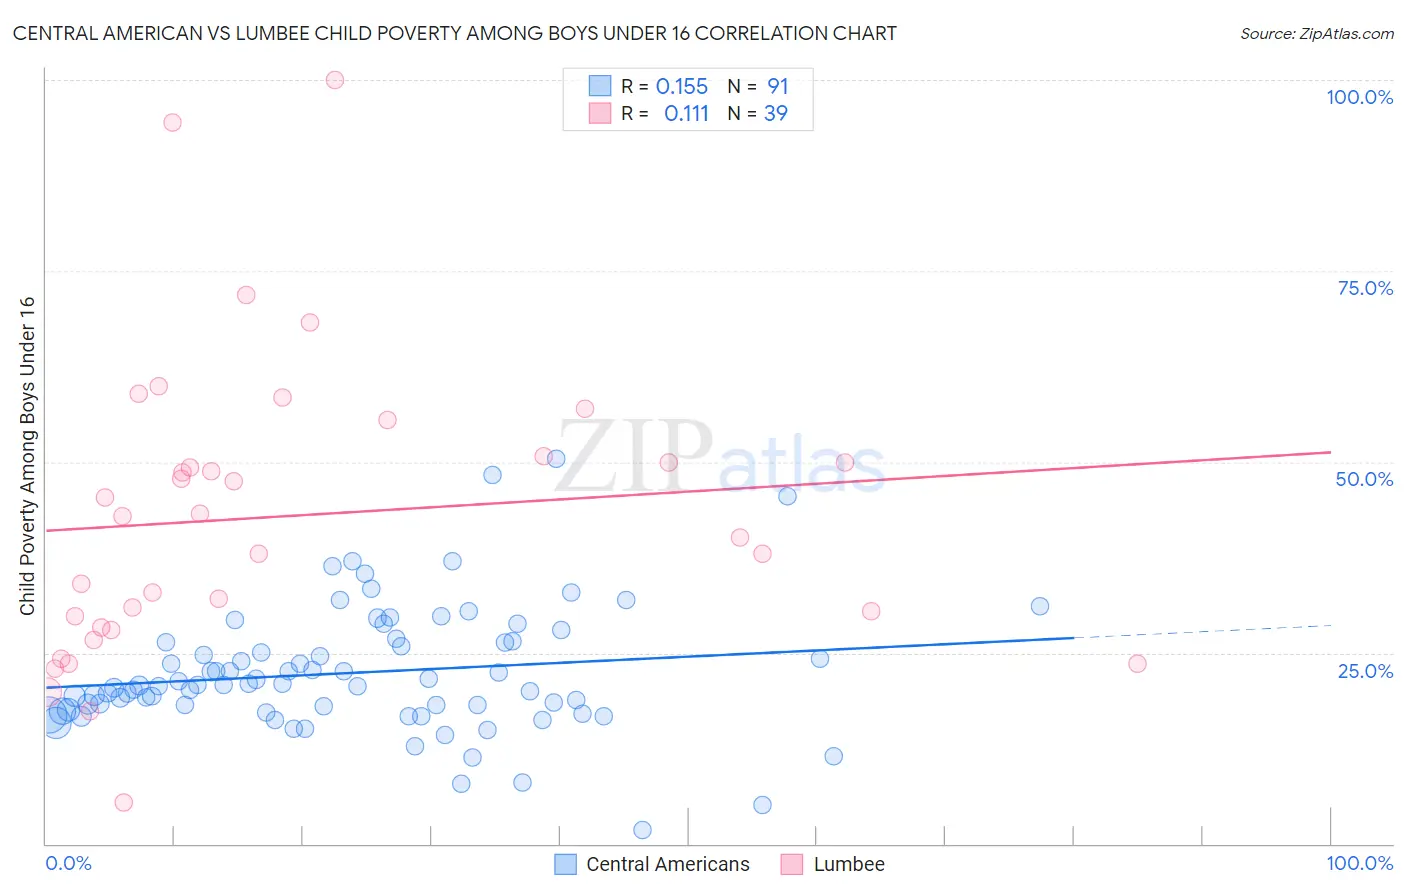
Central American vs Lumbee Child Poverty Among Boys Under 16 Correlation Chart
The statistical analysis conducted on geographies consisting of 494,011,112 people shows a poor positive correlation between the proportion of Central Americans and poverty level among boys under the age of 16 in the United States with a correlation coefficient (R) of 0.155 and weighted average of 20.1%. Similarly, the statistical analysis conducted on geographies consisting of 91,775,991 people shows a poor positive correlation between the proportion of Lumbee and poverty level among boys under the age of 16 in the United States with a correlation coefficient (R) of 0.111 and weighted average of 31.9%, a difference of 59.1%.
Child Poverty Among Boys Under 16 Correlation Summary
| Measurement | Central American | Lumbee |
| Minimum | 1.7% | 5.4% |
| Maximum | 50.4% | 100.0% |
| Range | 48.6% | 94.6% |
| Mean | 22.4% | 42.9% |
| Median | 20.7% | 42.9% |
| Interquartile 25% (IQ1) | 17.6% | 28.2% |
| Interquartile 75% (IQ3) | 26.3% | 50.7% |
| Interquartile Range (IQR) | 8.8% | 22.4% |
| Standard Deviation (Sample) | 8.2% | 19.5% |
| Standard Deviation (Population) | 8.2% | 19.3% |
Similar Demographics by Child Poverty Among Boys Under 16
Demographics Similar to Central Americans by Child Poverty Among Boys Under 16
In terms of child poverty among boys under 16, the demographic groups most similar to Central Americans are Immigrants from Zaire (20.1%, a difference of 0.060%), Comanche (20.1%, a difference of 0.11%), Bangladeshi (20.0%, a difference of 0.12%), Immigrants from Jamaica (20.1%, a difference of 0.24%), and Immigrants from West Indies (20.0%, a difference of 0.25%).
| Demographics | Rating | Rank | Child Poverty Among Boys Under 16 |
| Belizeans | 0.1 /100 | #273 | Tragic 19.9% |
| Immigrants | Bangladesh | 0.0 /100 | #274 | Tragic 19.9% |
| Jamaicans | 0.0 /100 | #275 | Tragic 20.0% |
| Sub-Saharan Africans | 0.0 /100 | #276 | Tragic 20.0% |
| Immigrants | Barbados | 0.0 /100 | #277 | Tragic 20.0% |
| Immigrants | West Indies | 0.0 /100 | #278 | Tragic 20.0% |
| Bangladeshis | 0.0 /100 | #279 | Tragic 20.0% |
| Central Americans | 0.0 /100 | #280 | Tragic 20.1% |
| Immigrants | Zaire | 0.0 /100 | #281 | Tragic 20.1% |
| Comanche | 0.0 /100 | #282 | Tragic 20.1% |
| Immigrants | Jamaica | 0.0 /100 | #283 | Tragic 20.1% |
| Barbadians | 0.0 /100 | #284 | Tragic 20.2% |
| Arapaho | 0.0 /100 | #285 | Tragic 20.2% |
| West Indians | 0.0 /100 | #286 | Tragic 20.3% |
| Immigrants | Belize | 0.0 /100 | #287 | Tragic 20.3% |
Demographics Similar to Lumbee by Child Poverty Among Boys Under 16
In terms of child poverty among boys under 16, the demographic groups most similar to Lumbee are Tohono O'odham (31.6%, a difference of 1.1%), Puerto Rican (32.8%, a difference of 2.9%), Yuman (30.6%, a difference of 4.2%), Navajo (30.3%, a difference of 5.4%), and Pima (29.7%, a difference of 7.3%).
| Demographics | Rating | Rank | Child Poverty Among Boys Under 16 |
| Apache | 0.0 /100 | #333 | Tragic 24.5% |
| Blacks/African Americans | 0.0 /100 | #334 | Tragic 24.5% |
| Yup'ik | 0.0 /100 | #335 | Tragic 24.7% |
| Sioux | 0.0 /100 | #336 | Tragic 25.3% |
| Cheyenne | 0.0 /100 | #337 | Tragic 25.8% |
| Hopi | 0.0 /100 | #338 | Tragic 25.9% |
| Houma | 0.0 /100 | #339 | Tragic 26.2% |
| Crow | 0.0 /100 | #340 | Tragic 26.3% |
| Immigrants | Yemen | 0.0 /100 | #341 | Tragic 28.9% |
| Pima | 0.0 /100 | #342 | Tragic 29.7% |
| Navajo | 0.0 /100 | #343 | Tragic 30.3% |
| Yuman | 0.0 /100 | #344 | Tragic 30.6% |
| Tohono O'odham | 0.0 /100 | #345 | Tragic 31.6% |
| Lumbee | 0.0 /100 | #346 | Tragic 31.9% |
| Puerto Ricans | 0.0 /100 | #347 | Tragic 32.8% |