Ecuadorian vs Hungarian Single Male Poverty
COMPARE
Ecuadorian
Hungarian
Single Male Poverty
Single Male Poverty Comparison
Ecuadorians
Hungarians
12.5%
SINGLE MALE POVERTY
85.9/ 100
METRIC RATING
128th/ 347
METRIC RANK
13.8%
SINGLE MALE POVERTY
0.3/ 100
METRIC RATING
261st/ 347
METRIC RANK
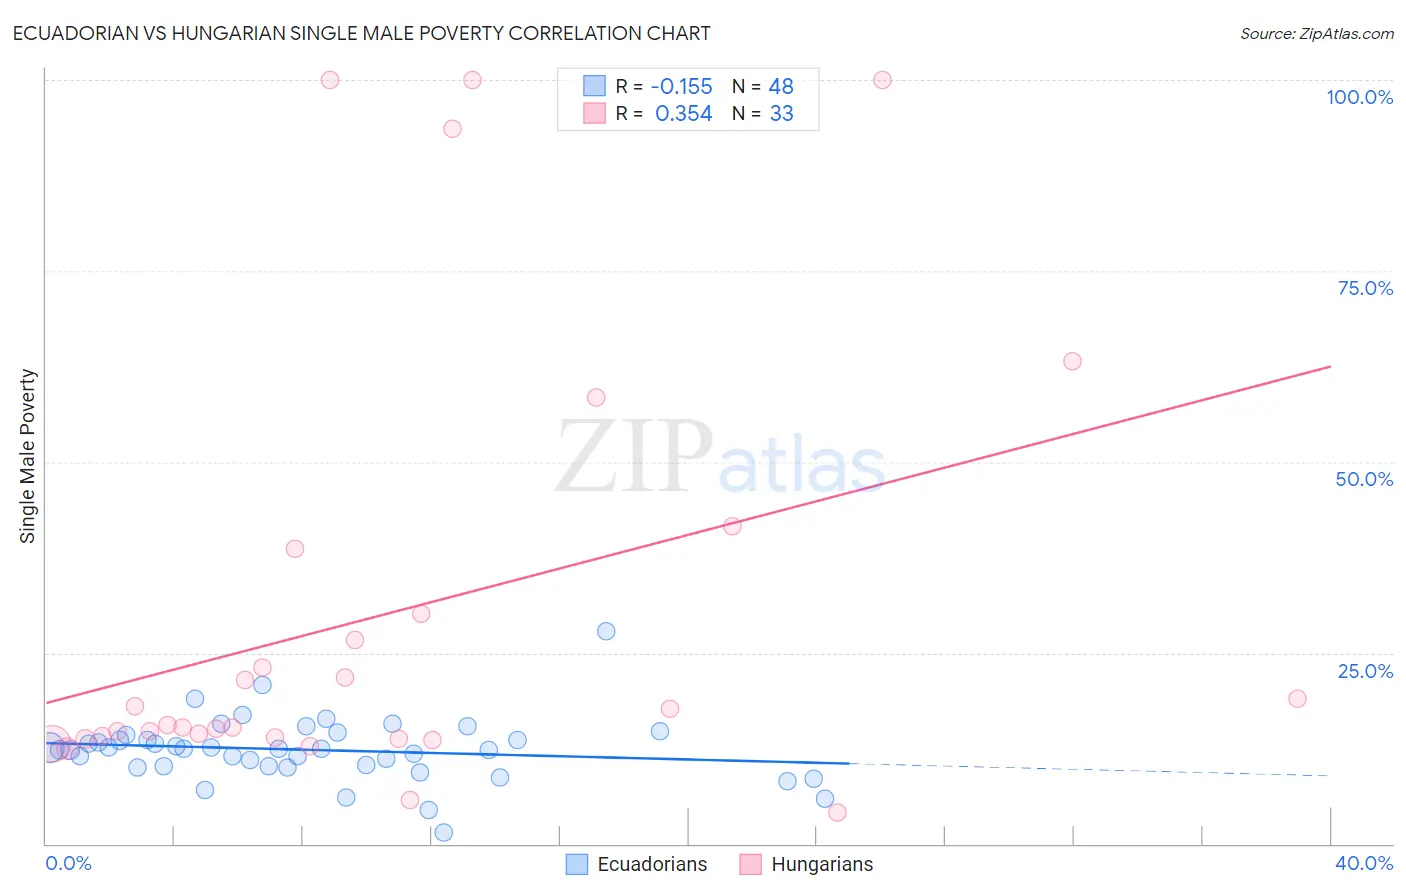
Ecuadorian vs Hungarian Single Male Poverty Correlation Chart
The statistical analysis conducted on geographies consisting of 286,561,230 people shows a poor negative correlation between the proportion of Ecuadorians and poverty level among single males in the United States with a correlation coefficient (R) of -0.155 and weighted average of 12.5%. Similarly, the statistical analysis conducted on geographies consisting of 413,693,148 people shows a mild positive correlation between the proportion of Hungarians and poverty level among single males in the United States with a correlation coefficient (R) of 0.354 and weighted average of 13.8%, a difference of 10.3%.
Single Male Poverty Correlation Summary
| Measurement | Ecuadorian | Hungarian |
| Minimum | 1.5% | 4.0% |
| Maximum | 27.8% | 100.0% |
| Range | 26.3% | 96.0% |
| Mean | 12.3% | 30.2% |
| Median | 12.4% | 15.5% |
| Interquartile 25% (IQ1) | 10.1% | 13.9% |
| Interquartile 75% (IQ3) | 13.9% | 34.3% |
| Interquartile Range (IQR) | 3.8% | 20.5% |
| Standard Deviation (Sample) | 4.2% | 28.8% |
| Standard Deviation (Population) | 4.2% | 28.4% |
Similar Demographics by Single Male Poverty
Demographics Similar to Ecuadorians by Single Male Poverty
In terms of single male poverty, the demographic groups most similar to Ecuadorians are Immigrants from Netherlands (12.5%, a difference of 0.040%), Immigrants from Sierra Leone (12.5%, a difference of 0.040%), Romanian (12.5%, a difference of 0.050%), Immigrants from Nicaragua (12.5%, a difference of 0.11%), and Immigrants from Jordan (12.5%, a difference of 0.14%).
| Demographics | Rating | Rank | Single Male Poverty |
| Icelanders | 88.2 /100 | #121 | Excellent 12.5% |
| Serbians | 87.9 /100 | #122 | Excellent 12.5% |
| Immigrants | Kenya | 87.6 /100 | #123 | Excellent 12.5% |
| Russians | 87.3 /100 | #124 | Excellent 12.5% |
| Immigrants | Jordan | 87.1 /100 | #125 | Excellent 12.5% |
| Romanians | 86.4 /100 | #126 | Excellent 12.5% |
| Immigrants | Netherlands | 86.2 /100 | #127 | Excellent 12.5% |
| Ecuadorians | 85.9 /100 | #128 | Excellent 12.5% |
| Immigrants | Sierra Leone | 85.5 /100 | #129 | Excellent 12.5% |
| Immigrants | Nicaragua | 84.8 /100 | #130 | Excellent 12.5% |
| Immigrants | Northern Europe | 83.7 /100 | #131 | Excellent 12.5% |
| Salvadorans | 83.7 /100 | #132 | Excellent 12.5% |
| Immigrants | Western Asia | 83.4 /100 | #133 | Excellent 12.5% |
| Immigrants | Ecuador | 82.1 /100 | #134 | Excellent 12.5% |
| Immigrants | Costa Rica | 81.9 /100 | #135 | Excellent 12.5% |
Demographics Similar to Hungarians by Single Male Poverty
In terms of single male poverty, the demographic groups most similar to Hungarians are Swiss (13.8%, a difference of 0.050%), Guatemalan (13.8%, a difference of 0.12%), Immigrants from Guatemala (13.8%, a difference of 0.16%), Fijian (13.8%, a difference of 0.17%), and Immigrants from Central America (13.8%, a difference of 0.23%).
| Demographics | Rating | Rank | Single Male Poverty |
| Sub-Saharan Africans | 0.5 /100 | #254 | Tragic 13.7% |
| Spaniards | 0.4 /100 | #255 | Tragic 13.7% |
| Immigrants | Belize | 0.4 /100 | #256 | Tragic 13.7% |
| Immigrants | Central America | 0.3 /100 | #257 | Tragic 13.8% |
| Immigrants | Guatemala | 0.3 /100 | #258 | Tragic 13.8% |
| Guatemalans | 0.3 /100 | #259 | Tragic 13.8% |
| Swiss | 0.3 /100 | #260 | Tragic 13.8% |
| Hungarians | 0.3 /100 | #261 | Tragic 13.8% |
| Fijians | 0.3 /100 | #262 | Tragic 13.8% |
| Cape Verdeans | 0.2 /100 | #263 | Tragic 13.8% |
| West Indians | 0.2 /100 | #264 | Tragic 13.8% |
| Immigrants | Congo | 0.2 /100 | #265 | Tragic 13.9% |
| Immigrants | Cabo Verde | 0.1 /100 | #266 | Tragic 13.9% |
| Germans | 0.1 /100 | #267 | Tragic 13.9% |
| Immigrants | Mexico | 0.1 /100 | #268 | Tragic 13.9% |