Eastern European vs Bhutanese Child Poverty Under the Age of 16
COMPARE
Eastern European
Bhutanese
Child Poverty Under the Age of 16
Child Poverty Under the Age of 16 Comparison
Eastern Europeans
Bhutanese
13.2%
CHILD POVERTY UNDER THE AGE OF 16
99.8/ 100
METRIC RATING
25th/ 347
METRIC RANK
12.5%
CHILD POVERTY UNDER THE AGE OF 16
99.9/ 100
METRIC RATING
11th/ 347
METRIC RANK
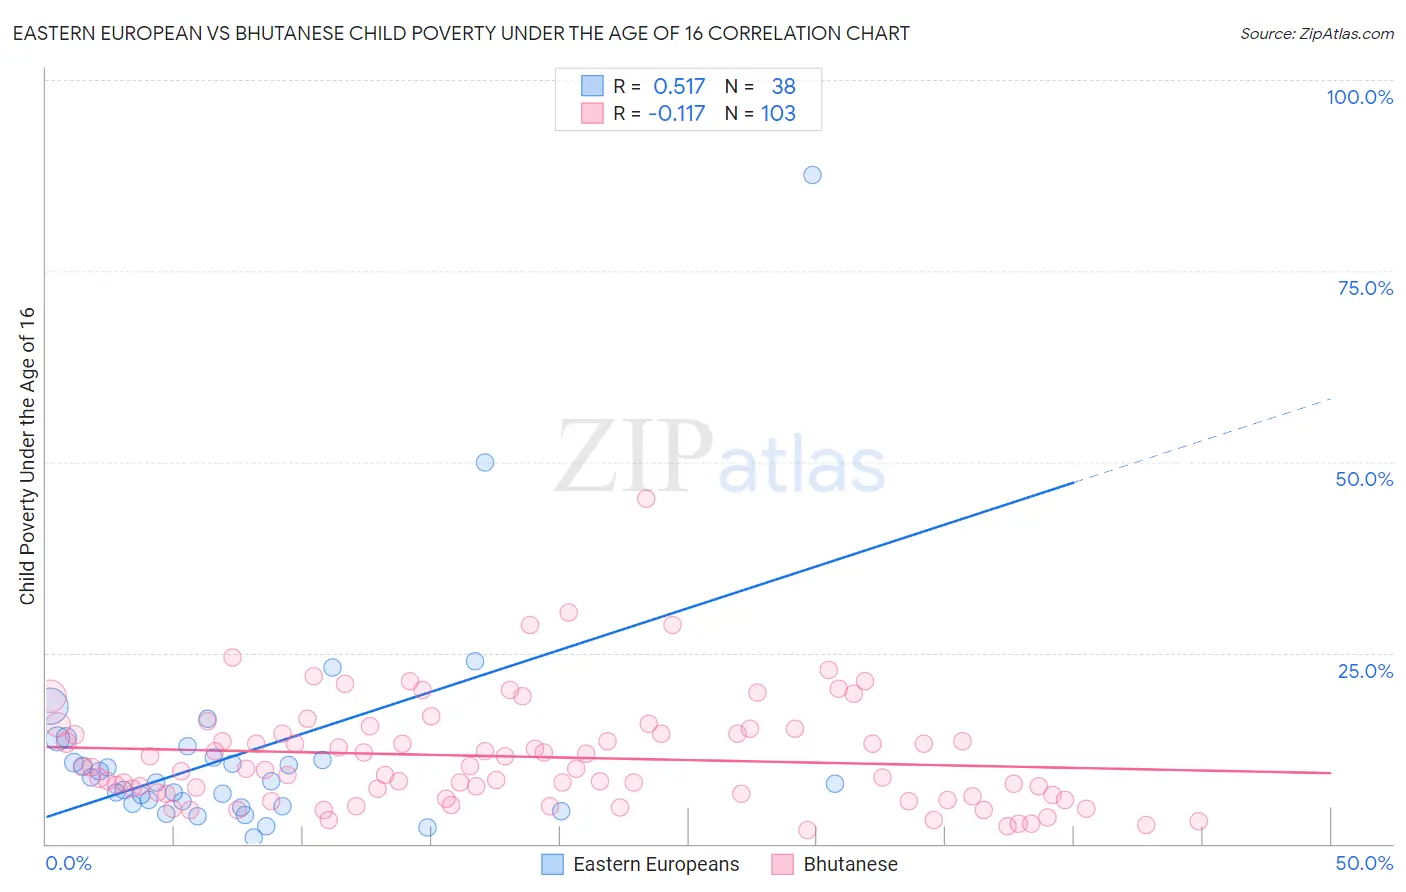
Eastern European vs Bhutanese Child Poverty Under the Age of 16 Correlation Chart
The statistical analysis conducted on geographies consisting of 454,217,761 people shows a substantial positive correlation between the proportion of Eastern Europeans and poverty level among children under the age of 16 in the United States with a correlation coefficient (R) of 0.517 and weighted average of 13.2%. Similarly, the statistical analysis conducted on geographies consisting of 450,361,741 people shows a poor negative correlation between the proportion of Bhutanese and poverty level among children under the age of 16 in the United States with a correlation coefficient (R) of -0.117 and weighted average of 12.5%, a difference of 5.2%.
Child Poverty Under the Age of 16 Correlation Summary
| Measurement | Eastern European | Bhutanese |
| Minimum | 0.77% | 1.9% |
| Maximum | 87.5% | 45.2% |
| Range | 86.7% | 43.3% |
| Mean | 12.0% | 11.4% |
| Median | 8.1% | 9.8% |
| Interquartile 25% (IQ1) | 5.2% | 6.4% |
| Interquartile 75% (IQ3) | 11.3% | 14.4% |
| Interquartile Range (IQR) | 6.1% | 8.1% |
| Standard Deviation (Sample) | 15.2% | 7.1% |
| Standard Deviation (Population) | 15.0% | 7.1% |
Demographics Similar to Eastern Europeans and Bhutanese by Child Poverty Under the Age of 16
In terms of child poverty under the age of 16, the demographic groups most similar to Eastern Europeans are Latvian (13.2%, a difference of 0.080%), Indian (Asian) (13.1%, a difference of 0.29%), Maltese (13.1%, a difference of 0.33%), Immigrants from Eastern Asia (13.1%, a difference of 0.41%), and Bolivian (13.2%, a difference of 0.42%). Similarly, the demographic groups most similar to Bhutanese are Immigrants from South Central Asia (12.5%, a difference of 0.010%), Immigrants from Ireland (12.7%, a difference of 1.1%), Immigrants from Iran (12.4%, a difference of 1.2%), Immigrants from Singapore (12.4%, a difference of 1.3%), and Burmese (12.8%, a difference of 2.2%).
| Demographics | Rating | Rank | Child Poverty Under the Age of 16 |
| Immigrants | Singapore | 100.0 /100 | #8 | Exceptional 12.4% |
| Immigrants | Iran | 100.0 /100 | #9 | Exceptional 12.4% |
| Immigrants | South Central Asia | 99.9 /100 | #10 | Exceptional 12.5% |
| Bhutanese | 99.9 /100 | #11 | Exceptional 12.5% |
| Immigrants | Ireland | 99.9 /100 | #12 | Exceptional 12.7% |
| Burmese | 99.9 /100 | #13 | Exceptional 12.8% |
| Immigrants | Lithuania | 99.9 /100 | #14 | Exceptional 12.9% |
| Immigrants | Korea | 99.9 /100 | #15 | Exceptional 13.0% |
| Norwegians | 99.9 /100 | #16 | Exceptional 13.0% |
| Bulgarians | 99.9 /100 | #17 | Exceptional 13.0% |
| Cypriots | 99.9 /100 | #18 | Exceptional 13.0% |
| Immigrants | Japan | 99.8 /100 | #19 | Exceptional 13.0% |
| Okinawans | 99.8 /100 | #20 | Exceptional 13.1% |
| Immigrants | Eastern Asia | 99.8 /100 | #21 | Exceptional 13.1% |
| Maltese | 99.8 /100 | #22 | Exceptional 13.1% |
| Indians (Asian) | 99.8 /100 | #23 | Exceptional 13.1% |
| Latvians | 99.8 /100 | #24 | Exceptional 13.2% |
| Eastern Europeans | 99.8 /100 | #25 | Exceptional 13.2% |
| Bolivians | 99.8 /100 | #26 | Exceptional 13.2% |
| Immigrants | China | 99.8 /100 | #27 | Exceptional 13.3% |
| Assyrians/Chaldeans/Syriacs | 99.7 /100 | #28 | Exceptional 13.3% |