Eastern European vs Immigrants from Northern Africa Receiving Food Stamps
COMPARE
Eastern European
Immigrants from Northern Africa
Receiving Food Stamps
Receiving Food Stamps Comparison
Eastern Europeans
Immigrants from Northern Africa
9.2%
RECEIVING FOOD STAMPS
99.8/ 100
METRIC RATING
23rd/ 347
METRIC RANK
11.0%
RECEIVING FOOD STAMPS
86.0/ 100
METRIC RATING
143rd/ 347
METRIC RANK
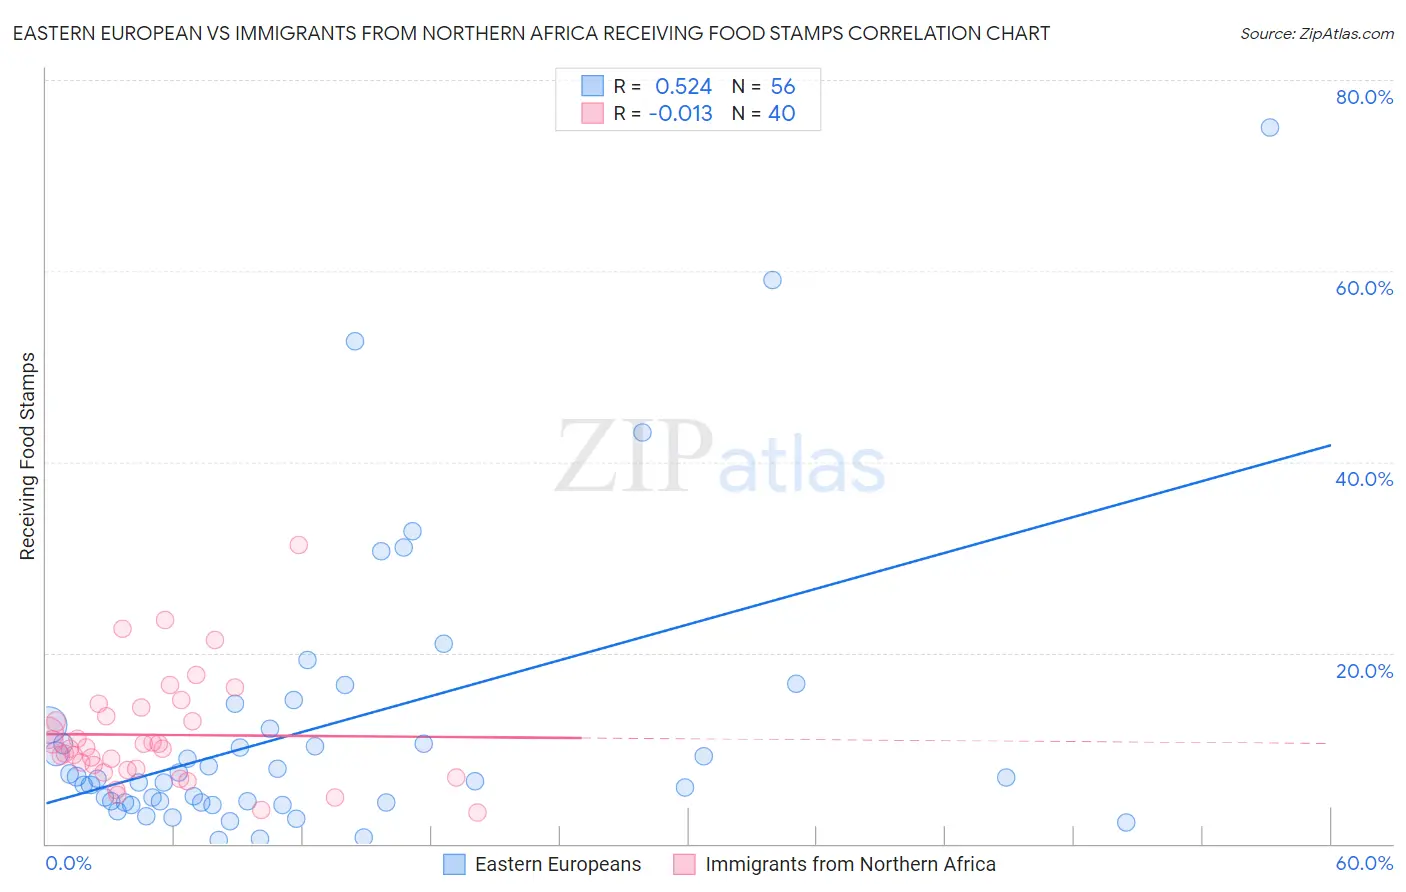
Eastern European vs Immigrants from Northern Africa Receiving Food Stamps Correlation Chart
The statistical analysis conducted on geographies consisting of 459,222,528 people shows a substantial positive correlation between the proportion of Eastern Europeans and percentage of population receiving government assistance and/or food stamps in the United States with a correlation coefficient (R) of 0.524 and weighted average of 9.2%. Similarly, the statistical analysis conducted on geographies consisting of 320,586,734 people shows no correlation between the proportion of Immigrants from Northern Africa and percentage of population receiving government assistance and/or food stamps in the United States with a correlation coefficient (R) of -0.013 and weighted average of 11.0%, a difference of 19.9%.
Receiving Food Stamps Correlation Summary
| Measurement | Eastern European | Immigrants from Northern Africa |
| Minimum | 0.35% | 3.3% |
| Maximum | 75.0% | 31.3% |
| Range | 74.7% | 28.0% |
| Mean | 12.1% | 11.4% |
| Median | 6.9% | 10.1% |
| Interquartile 25% (IQ1) | 4.3% | 7.8% |
| Interquartile 75% (IQ3) | 12.2% | 13.9% |
| Interquartile Range (IQR) | 7.9% | 6.1% |
| Standard Deviation (Sample) | 14.8% | 5.8% |
| Standard Deviation (Population) | 14.7% | 5.7% |
Similar Demographics by Receiving Food Stamps
Demographics Similar to Eastern Europeans by Receiving Food Stamps
In terms of receiving food stamps, the demographic groups most similar to Eastern Europeans are Immigrants from Northern Europe (9.2%, a difference of 0.020%), Immigrants from Australia (9.2%, a difference of 0.11%), Immigrants from Ireland (9.2%, a difference of 0.13%), Swedish (9.2%, a difference of 0.32%), and Luxembourger (9.1%, a difference of 0.36%).
| Demographics | Rating | Rank | Receiving Food Stamps |
| Immigrants | Japan | 99.9 /100 | #16 | Exceptional 9.0% |
| Immigrants | Scotland | 99.9 /100 | #17 | Exceptional 9.0% |
| Danes | 99.9 /100 | #18 | Exceptional 9.0% |
| Immigrants | Hong Kong | 99.8 /100 | #19 | Exceptional 9.1% |
| Latvians | 99.8 /100 | #20 | Exceptional 9.1% |
| Luxembourgers | 99.8 /100 | #21 | Exceptional 9.1% |
| Immigrants | Australia | 99.8 /100 | #22 | Exceptional 9.2% |
| Eastern Europeans | 99.8 /100 | #23 | Exceptional 9.2% |
| Immigrants | Northern Europe | 99.8 /100 | #24 | Exceptional 9.2% |
| Immigrants | Ireland | 99.8 /100 | #25 | Exceptional 9.2% |
| Swedes | 99.8 /100 | #26 | Exceptional 9.2% |
| Bhutanese | 99.8 /100 | #27 | Exceptional 9.2% |
| Czechs | 99.8 /100 | #28 | Exceptional 9.2% |
| Immigrants | Lithuania | 99.8 /100 | #29 | Exceptional 9.2% |
| Immigrants | Sweden | 99.7 /100 | #30 | Exceptional 9.3% |
Demographics Similar to Immigrants from Northern Africa by Receiving Food Stamps
In terms of receiving food stamps, the demographic groups most similar to Immigrants from Northern Africa are Chilean (11.0%, a difference of 0.080%), Syrian (11.0%, a difference of 0.15%), Immigrants from Vietnam (11.0%, a difference of 0.25%), Hungarian (11.0%, a difference of 0.27%), and Taiwanese (11.0%, a difference of 0.51%).
| Demographics | Rating | Rank | Receiving Food Stamps |
| Slovaks | 89.8 /100 | #136 | Excellent 10.8% |
| Immigrants | Eastern Europe | 89.8 /100 | #137 | Excellent 10.8% |
| Immigrants | Moldova | 88.5 /100 | #138 | Excellent 10.9% |
| Hmong | 88.4 /100 | #139 | Excellent 10.9% |
| Celtics | 87.8 /100 | #140 | Excellent 10.9% |
| Immigrants | Vietnam | 86.7 /100 | #141 | Excellent 11.0% |
| Chileans | 86.2 /100 | #142 | Excellent 11.0% |
| Immigrants | Northern Africa | 86.0 /100 | #143 | Excellent 11.0% |
| Syrians | 85.5 /100 | #144 | Excellent 11.0% |
| Hungarians | 85.1 /100 | #145 | Excellent 11.0% |
| Taiwanese | 84.2 /100 | #146 | Excellent 11.0% |
| Whites/Caucasians | 83.9 /100 | #147 | Excellent 11.1% |
| Immigrants | South Eastern Asia | 83.3 /100 | #148 | Excellent 11.1% |
| Brazilians | 83.2 /100 | #149 | Excellent 11.1% |
| Soviet Union | 83.1 /100 | #150 | Excellent 11.1% |