Dutch West Indian vs Moroccan Single Mother Poverty
COMPARE
Dutch West Indian
Moroccan
Single Mother Poverty
Single Mother Poverty Comparison
Dutch West Indians
Moroccans
36.8%
SINGLE MOTHER POVERTY
0.0/ 100
METRIC RATING
332nd/ 347
METRIC RANK
29.5%
SINGLE MOTHER POVERTY
28.6/ 100
METRIC RATING
192nd/ 347
METRIC RANK
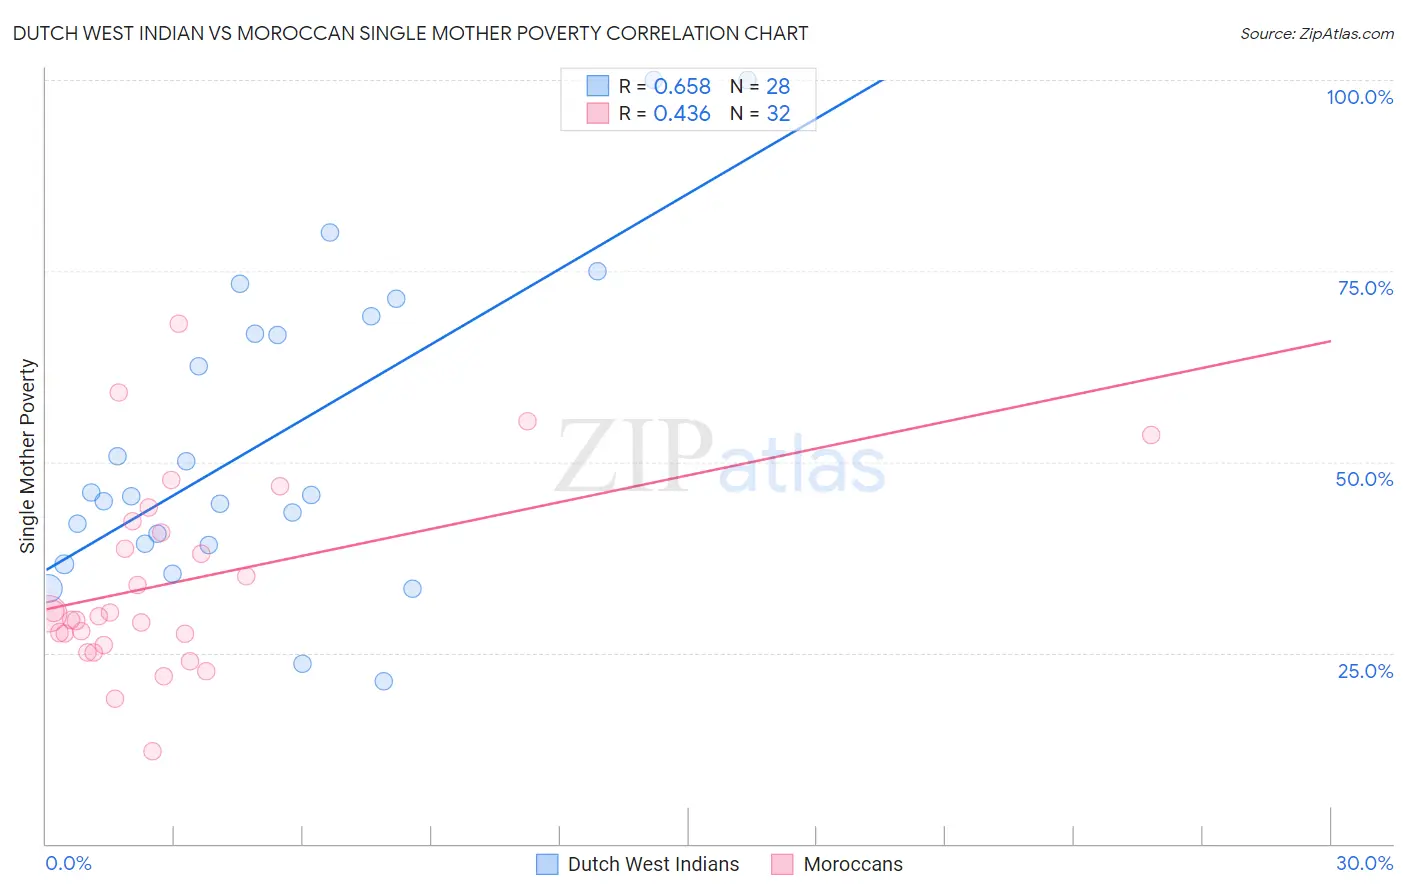
Dutch West Indian vs Moroccan Single Mother Poverty Correlation Chart
The statistical analysis conducted on geographies consisting of 85,385,586 people shows a significant positive correlation between the proportion of Dutch West Indians and poverty level among single mothers in the United States with a correlation coefficient (R) of 0.658 and weighted average of 36.8%. Similarly, the statistical analysis conducted on geographies consisting of 199,317,261 people shows a moderate positive correlation between the proportion of Moroccans and poverty level among single mothers in the United States with a correlation coefficient (R) of 0.436 and weighted average of 29.5%, a difference of 24.7%.
Single Mother Poverty Correlation Summary
| Measurement | Dutch West Indian | Moroccan |
| Minimum | 21.3% | 12.2% |
| Maximum | 100.0% | 68.0% |
| Range | 78.7% | 55.9% |
| Mean | 52.8% | 34.3% |
| Median | 45.6% | 30.0% |
| Interquartile 25% (IQ1) | 39.2% | 26.7% |
| Interquartile 75% (IQ3) | 67.9% | 41.5% |
| Interquartile Range (IQR) | 28.7% | 14.8% |
| Standard Deviation (Sample) | 20.5% | 12.5% |
| Standard Deviation (Population) | 20.2% | 12.3% |
Similar Demographics by Single Mother Poverty
Demographics Similar to Dutch West Indians by Single Mother Poverty
In terms of single mother poverty, the demographic groups most similar to Dutch West Indians are Creek (36.7%, a difference of 0.24%), Native/Alaskan (36.6%, a difference of 0.40%), Apache (36.6%, a difference of 0.50%), Menominee (37.1%, a difference of 0.78%), and Choctaw (36.4%, a difference of 0.98%).
| Demographics | Rating | Rank | Single Mother Poverty |
| Ute | 0.0 /100 | #325 | Tragic 35.7% |
| Seminole | 0.0 /100 | #326 | Tragic 35.8% |
| Yakama | 0.0 /100 | #327 | Tragic 36.4% |
| Choctaw | 0.0 /100 | #328 | Tragic 36.4% |
| Apache | 0.0 /100 | #329 | Tragic 36.6% |
| Natives/Alaskans | 0.0 /100 | #330 | Tragic 36.6% |
| Creek | 0.0 /100 | #331 | Tragic 36.7% |
| Dutch West Indians | 0.0 /100 | #332 | Tragic 36.8% |
| Menominee | 0.0 /100 | #333 | Tragic 37.1% |
| Pueblo | 0.0 /100 | #334 | Tragic 37.2% |
| Yuman | 0.0 /100 | #335 | Tragic 37.8% |
| Cheyenne | 0.0 /100 | #336 | Tragic 38.5% |
| Immigrants | Yemen | 0.0 /100 | #337 | Tragic 38.5% |
| Pima | 0.0 /100 | #338 | Tragic 38.6% |
| Crow | 0.0 /100 | #339 | Tragic 38.6% |
Demographics Similar to Moroccans by Single Mother Poverty
In terms of single mother poverty, the demographic groups most similar to Moroccans are Basque (29.5%, a difference of 0.020%), Immigrants from Trinidad and Tobago (29.5%, a difference of 0.030%), Immigrants from Germany (29.5%, a difference of 0.10%), Icelander (29.5%, a difference of 0.15%), and Immigrants from Africa (29.4%, a difference of 0.17%).
| Demographics | Rating | Rank | Single Mother Poverty |
| Ghanaians | 36.8 /100 | #185 | Fair 29.4% |
| Yugoslavians | 36.0 /100 | #186 | Fair 29.4% |
| Lebanese | 32.5 /100 | #187 | Fair 29.4% |
| Guamanians/Chamorros | 31.8 /100 | #188 | Fair 29.4% |
| Immigrants | Africa | 31.6 /100 | #189 | Fair 29.4% |
| Immigrants | Germany | 30.4 /100 | #190 | Fair 29.5% |
| Immigrants | Trinidad and Tobago | 29.2 /100 | #191 | Fair 29.5% |
| Moroccans | 28.6 /100 | #192 | Fair 29.5% |
| Basques | 28.3 /100 | #193 | Fair 29.5% |
| Icelanders | 26.1 /100 | #194 | Fair 29.5% |
| Slavs | 24.5 /100 | #195 | Fair 29.6% |
| Spanish American Indians | 23.4 /100 | #196 | Fair 29.6% |
| Immigrants | Jamaica | 22.0 /100 | #197 | Fair 29.6% |
| Trinidadians and Tobagonians | 21.7 /100 | #198 | Fair 29.6% |
| Cubans | 20.8 /100 | #199 | Fair 29.6% |