Samoan vs Moroccan Single Mother Poverty
COMPARE
Samoan
Moroccan
Single Mother Poverty
Single Mother Poverty Comparison
Samoans
Moroccans
28.5%
SINGLE MOTHER POVERTY
88.1/ 100
METRIC RATING
139th/ 347
METRIC RANK
29.5%
SINGLE MOTHER POVERTY
28.6/ 100
METRIC RATING
192nd/ 347
METRIC RANK
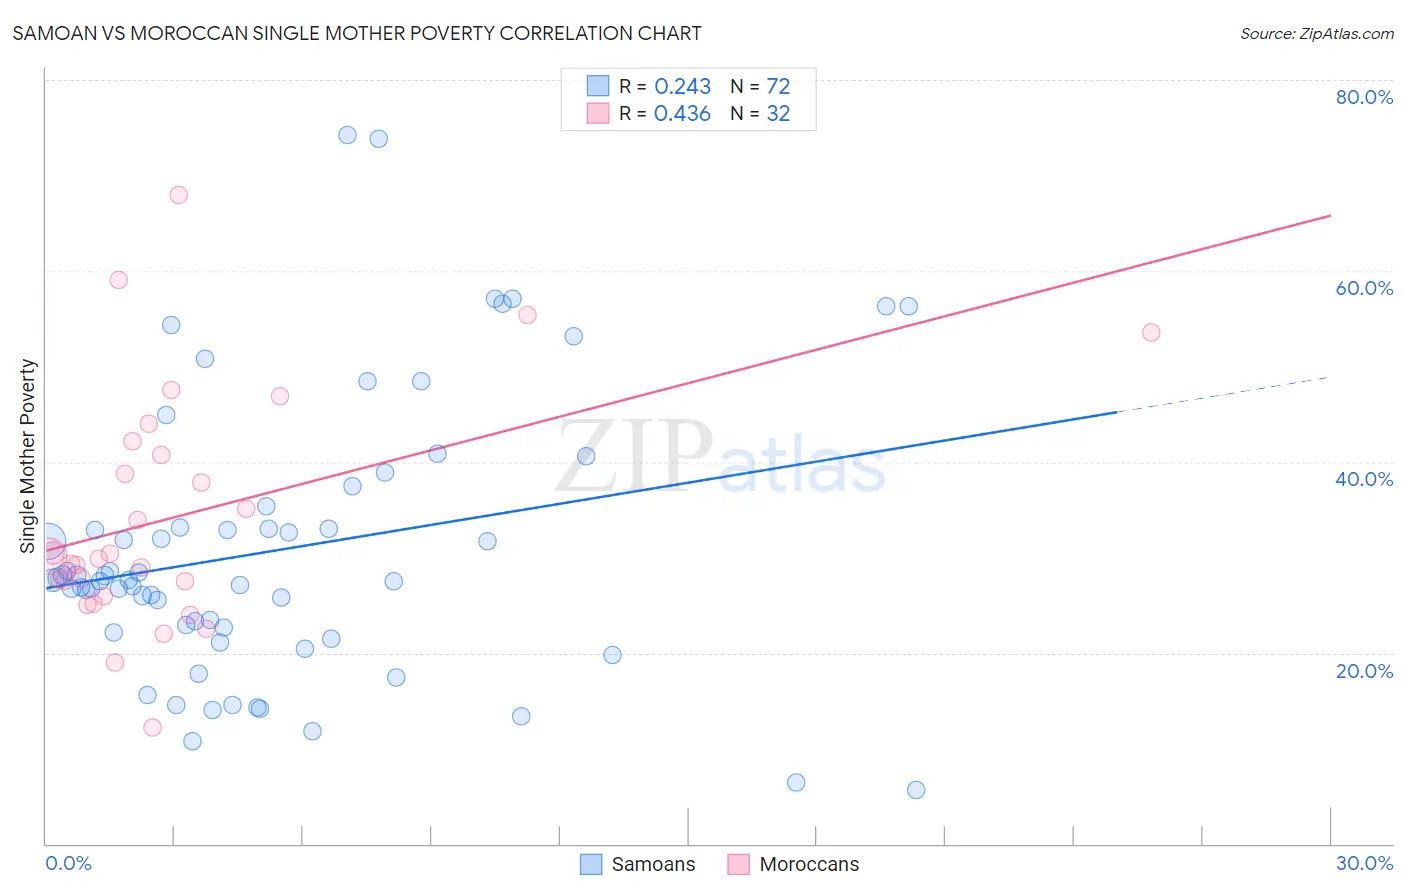
Samoan vs Moroccan Single Mother Poverty Correlation Chart
The statistical analysis conducted on geographies consisting of 223,207,663 people shows a weak positive correlation between the proportion of Samoans and poverty level among single mothers in the United States with a correlation coefficient (R) of 0.243 and weighted average of 28.5%. Similarly, the statistical analysis conducted on geographies consisting of 199,317,261 people shows a moderate positive correlation between the proportion of Moroccans and poverty level among single mothers in the United States with a correlation coefficient (R) of 0.436 and weighted average of 29.5%, a difference of 3.6%.
Single Mother Poverty Correlation Summary
| Measurement | Samoan | Moroccan |
| Minimum | 5.6% | 12.2% |
| Maximum | 74.3% | 68.0% |
| Range | 68.7% | 55.9% |
| Mean | 30.8% | 34.3% |
| Median | 27.6% | 30.0% |
| Interquartile 25% (IQ1) | 22.4% | 26.7% |
| Interquartile 75% (IQ3) | 34.3% | 41.5% |
| Interquartile Range (IQR) | 11.9% | 14.8% |
| Standard Deviation (Sample) | 14.5% | 12.5% |
| Standard Deviation (Population) | 14.4% | 12.3% |
Similar Demographics by Single Mother Poverty
Demographics Similar to Samoans by Single Mother Poverty
In terms of single mother poverty, the demographic groups most similar to Samoans are Immigrants from Colombia (28.5%, a difference of 0.010%), Immigrants from Belgium (28.5%, a difference of 0.050%), Native Hawaiian (28.4%, a difference of 0.10%), Immigrants from Canada (28.4%, a difference of 0.10%), and Danish (28.5%, a difference of 0.11%).
| Demographics | Rating | Rank | Single Mother Poverty |
| Immigrants | Morocco | 89.5 /100 | #132 | Excellent 28.4% |
| Swedes | 89.4 /100 | #133 | Excellent 28.4% |
| Immigrants | Southern Europe | 89.2 /100 | #134 | Excellent 28.4% |
| Immigrants | Spain | 89.2 /100 | #135 | Excellent 28.4% |
| Native Hawaiians | 88.9 /100 | #136 | Excellent 28.4% |
| Immigrants | Canada | 88.9 /100 | #137 | Excellent 28.4% |
| Immigrants | Belgium | 88.5 /100 | #138 | Excellent 28.5% |
| Samoans | 88.1 /100 | #139 | Excellent 28.5% |
| Immigrants | Colombia | 88.0 /100 | #140 | Excellent 28.5% |
| Danes | 87.1 /100 | #141 | Excellent 28.5% |
| South Africans | 86.6 /100 | #142 | Excellent 28.5% |
| Immigrants | North America | 86.5 /100 | #143 | Excellent 28.5% |
| Luxembourgers | 86.4 /100 | #144 | Excellent 28.5% |
| Immigrants | South America | 86.1 /100 | #145 | Excellent 28.5% |
| Immigrants | Denmark | 86.1 /100 | #146 | Excellent 28.5% |
Demographics Similar to Moroccans by Single Mother Poverty
In terms of single mother poverty, the demographic groups most similar to Moroccans are Basque (29.5%, a difference of 0.020%), Immigrants from Trinidad and Tobago (29.5%, a difference of 0.030%), Immigrants from Germany (29.5%, a difference of 0.10%), Icelander (29.5%, a difference of 0.15%), and Immigrants from Africa (29.4%, a difference of 0.17%).
| Demographics | Rating | Rank | Single Mother Poverty |
| Ghanaians | 36.8 /100 | #185 | Fair 29.4% |
| Yugoslavians | 36.0 /100 | #186 | Fair 29.4% |
| Lebanese | 32.5 /100 | #187 | Fair 29.4% |
| Guamanians/Chamorros | 31.8 /100 | #188 | Fair 29.4% |
| Immigrants | Africa | 31.6 /100 | #189 | Fair 29.4% |
| Immigrants | Germany | 30.4 /100 | #190 | Fair 29.5% |
| Immigrants | Trinidad and Tobago | 29.2 /100 | #191 | Fair 29.5% |
| Moroccans | 28.6 /100 | #192 | Fair 29.5% |
| Basques | 28.3 /100 | #193 | Fair 29.5% |
| Icelanders | 26.1 /100 | #194 | Fair 29.5% |
| Slavs | 24.5 /100 | #195 | Fair 29.6% |
| Spanish American Indians | 23.4 /100 | #196 | Fair 29.6% |
| Immigrants | Jamaica | 22.0 /100 | #197 | Fair 29.6% |
| Trinidadians and Tobagonians | 21.7 /100 | #198 | Fair 29.6% |
| Cubans | 20.8 /100 | #199 | Fair 29.6% |