Dutch vs Scotch-Irish Seniors Poverty Over the Age of 75
COMPARE
Dutch
Scotch-Irish
Seniors Poverty Over the Age of 75
Seniors Poverty Over the Age of 75 Comparison
Dutch
Scotch-Irish
10.5%
SENIORS POVERTY OVER THE AGE OF 75
99.9/ 100
METRIC RATING
16th/ 347
METRIC RANK
10.8%
SENIORS POVERTY OVER THE AGE OF 75
99.6/ 100
METRIC RATING
36th/ 347
METRIC RANK
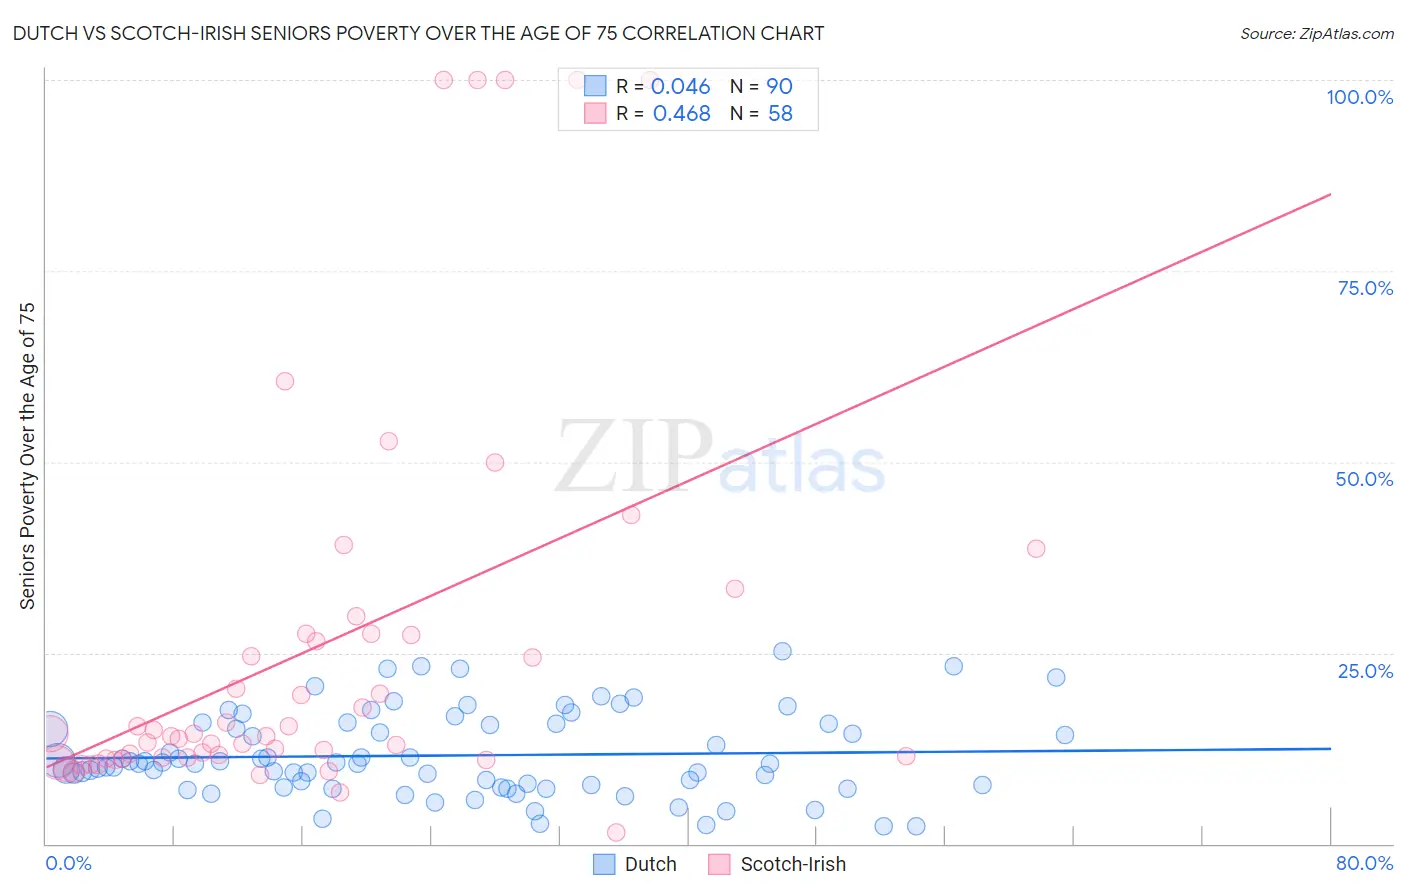
Dutch vs Scotch-Irish Seniors Poverty Over the Age of 75 Correlation Chart
The statistical analysis conducted on geographies consisting of 539,215,088 people shows no correlation between the proportion of Dutch and poverty level among seniors over the age of 75 in the United States with a correlation coefficient (R) of 0.046 and weighted average of 10.5%. Similarly, the statistical analysis conducted on geographies consisting of 534,526,562 people shows a moderate positive correlation between the proportion of Scotch-Irish and poverty level among seniors over the age of 75 in the United States with a correlation coefficient (R) of 0.468 and weighted average of 10.8%, a difference of 2.7%.
Seniors Poverty Over the Age of 75 Correlation Summary
| Measurement | Dutch | Scotch-Irish |
| Minimum | 2.2% | 1.4% |
| Maximum | 25.2% | 100.0% |
| Range | 23.0% | 98.6% |
| Mean | 11.6% | 25.7% |
| Median | 10.5% | 14.2% |
| Interquartile 25% (IQ1) | 7.6% | 11.2% |
| Interquartile 75% (IQ3) | 15.7% | 27.4% |
| Interquartile Range (IQR) | 8.1% | 16.2% |
| Standard Deviation (Sample) | 5.4% | 25.9% |
| Standard Deviation (Population) | 5.4% | 25.6% |
Demographics Similar to Dutch and Scotch-Irish by Seniors Poverty Over the Age of 75
In terms of seniors poverty over the age of 75, the demographic groups most similar to Dutch are Slovak (10.5%, a difference of 0.21%), Welsh (10.5%, a difference of 0.21%), Immigrants from Scotland (10.5%, a difference of 0.25%), Czech (10.5%, a difference of 0.26%), and Slovene (10.6%, a difference of 0.31%). Similarly, the demographic groups most similar to Scotch-Irish are Luxembourger (10.8%, a difference of 0.050%), Italian (10.8%, a difference of 0.43%), Puget Sound Salish (10.8%, a difference of 0.49%), British (10.7%, a difference of 0.54%), and Marshallese (10.7%, a difference of 0.68%).
| Demographics | Rating | Rank | Seniors Poverty Over the Age of 75 |
| Dutch | 99.9 /100 | #16 | Exceptional 10.5% |
| Slovaks | 99.9 /100 | #17 | Exceptional 10.5% |
| Welsh | 99.9 /100 | #18 | Exceptional 10.5% |
| Immigrants | Scotland | 99.9 /100 | #19 | Exceptional 10.5% |
| Czechs | 99.9 /100 | #20 | Exceptional 10.5% |
| Slovenes | 99.9 /100 | #21 | Exceptional 10.6% |
| Bhutanese | 99.8 /100 | #22 | Exceptional 10.6% |
| Lithuanians | 99.8 /100 | #23 | Exceptional 10.6% |
| Poles | 99.8 /100 | #24 | Exceptional 10.6% |
| Menominee | 99.8 /100 | #25 | Exceptional 10.6% |
| Bulgarians | 99.8 /100 | #26 | Exceptional 10.7% |
| Northern Europeans | 99.8 /100 | #27 | Exceptional 10.7% |
| Irish | 99.8 /100 | #28 | Exceptional 10.7% |
| Assyrians/Chaldeans/Syriacs | 99.8 /100 | #29 | Exceptional 10.7% |
| Swiss | 99.7 /100 | #30 | Exceptional 10.7% |
| Marshallese | 99.7 /100 | #31 | Exceptional 10.7% |
| British | 99.7 /100 | #32 | Exceptional 10.7% |
| Puget Sound Salish | 99.7 /100 | #33 | Exceptional 10.8% |
| Italians | 99.7 /100 | #34 | Exceptional 10.8% |
| Luxembourgers | 99.6 /100 | #35 | Exceptional 10.8% |
| Scotch-Irish | 99.6 /100 | #36 | Exceptional 10.8% |