Dutch vs Mongolian Child Poverty Among Girls Under 16
COMPARE
Dutch
Mongolian
Child Poverty Among Girls Under 16
Child Poverty Among Girls Under 16 Comparison
Dutch
Mongolians
15.1%
CHILD POVERTY AMONG GIRLS UNDER 16
94.3/ 100
METRIC RATING
113th/ 347
METRIC RANK
15.4%
CHILD POVERTY AMONG GIRLS UNDER 16
89.7/ 100
METRIC RATING
132nd/ 347
METRIC RANK
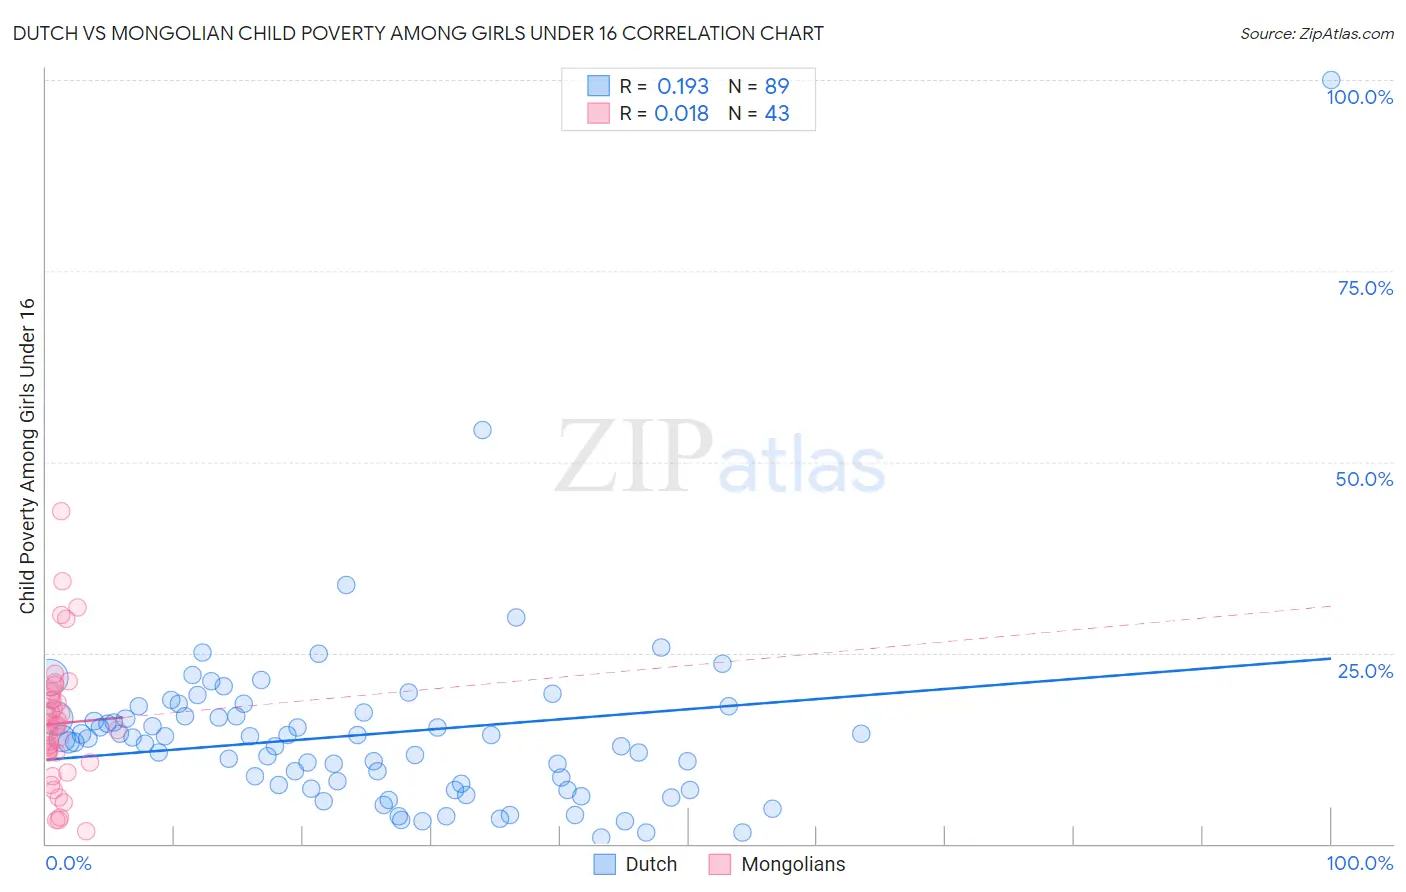
Dutch vs Mongolian Child Poverty Among Girls Under 16 Correlation Chart
The statistical analysis conducted on geographies consisting of 533,855,440 people shows a poor positive correlation between the proportion of Dutch and poverty level among girls under the age of 16 in the United States with a correlation coefficient (R) of 0.193 and weighted average of 15.1%. Similarly, the statistical analysis conducted on geographies consisting of 139,540,451 people shows no correlation between the proportion of Mongolians and poverty level among girls under the age of 16 in the United States with a correlation coefficient (R) of 0.018 and weighted average of 15.4%, a difference of 2.0%.
Child Poverty Among Girls Under 16 Correlation Summary
| Measurement | Dutch | Mongolian |
| Minimum | 0.74% | 1.6% |
| Maximum | 100.0% | 43.5% |
| Range | 99.3% | 41.9% |
| Mean | 14.3% | 15.8% |
| Median | 13.8% | 15.3% |
| Interquartile 25% (IQ1) | 7.4% | 10.7% |
| Interquartile 75% (IQ3) | 17.0% | 19.6% |
| Interquartile Range (IQR) | 9.5% | 8.9% |
| Standard Deviation (Sample) | 12.2% | 8.7% |
| Standard Deviation (Population) | 12.1% | 8.6% |
Demographics Similar to Dutch and Mongolians by Child Poverty Among Girls Under 16
In terms of child poverty among girls under 16, the demographic groups most similar to Dutch are Immigrants from Kazakhstan (15.1%, a difference of 0.020%), Sri Lankan (15.2%, a difference of 0.13%), Belgian (15.2%, a difference of 0.19%), Immigrants from Denmark (15.2%, a difference of 0.51%), and Immigrants from North Macedonia (15.2%, a difference of 0.60%). Similarly, the demographic groups most similar to Mongolians are Immigrants from Western Europe (15.4%, a difference of 0.11%), Puget Sound Salish (15.4%, a difference of 0.13%), Immigrants from South Eastern Asia (15.4%, a difference of 0.29%), Albanian (15.4%, a difference of 0.30%), and Immigrants from Norway (15.4%, a difference of 0.39%).
| Demographics | Rating | Rank | Child Poverty Among Girls Under 16 |
| Immigrants | Kazakhstan | 94.3 /100 | #112 | Exceptional 15.1% |
| Dutch | 94.3 /100 | #113 | Exceptional 15.1% |
| Sri Lankans | 94.0 /100 | #114 | Exceptional 15.2% |
| Belgians | 93.9 /100 | #115 | Exceptional 15.2% |
| Immigrants | Denmark | 93.3 /100 | #116 | Exceptional 15.2% |
| Immigrants | North Macedonia | 93.1 /100 | #117 | Exceptional 15.2% |
| Immigrants | Southern Europe | 92.7 /100 | #118 | Exceptional 15.3% |
| Immigrants | Zimbabwe | 92.5 /100 | #119 | Exceptional 15.3% |
| Pakistanis | 92.3 /100 | #120 | Exceptional 15.3% |
| English | 92.2 /100 | #121 | Exceptional 15.3% |
| Portuguese | 91.8 /100 | #122 | Exceptional 15.3% |
| Irish | 91.5 /100 | #123 | Exceptional 15.3% |
| Carpatho Rusyns | 91.4 /100 | #124 | Exceptional 15.3% |
| Peruvians | 91.2 /100 | #125 | Exceptional 15.4% |
| Scottish | 91.0 /100 | #126 | Exceptional 15.4% |
| Immigrants | Norway | 90.8 /100 | #127 | Exceptional 15.4% |
| Albanians | 90.5 /100 | #128 | Exceptional 15.4% |
| Immigrants | South Eastern Asia | 90.5 /100 | #129 | Exceptional 15.4% |
| Puget Sound Salish | 90.1 /100 | #130 | Exceptional 15.4% |
| Immigrants | Western Europe | 90.0 /100 | #131 | Exceptional 15.4% |
| Mongolians | 89.7 /100 | #132 | Excellent 15.4% |