Dominican vs Immigrants from Kazakhstan Kindergarten

COMPARE

Dominican
Race
Ancestry
AfghanAfricanAlaska NativeAlaskan AthabascanAlbanianAleutAlsatianAmericanApacheArabArapahoArgentineanArmenianAssyrian/Chaldean/SyriacAustralianAustrianBahamianBangladeshiBarbadianBasqueBelgianBelizeanBermudanBhutaneseBlackfeetBolivianBrazilianBritishBritish West IndianBulgarianBurmeseCajunCambodianCanadianCape VerdeanCarpatho RusynCelticCentral AmericanCentral American IndianCherokeeCheyenneChickasawChileanChineseChippewaChoctawColombianColvilleComancheCosta RicanCreeCreekCroatianCrowCubanCypriotCzechCzechoslovakianDanishDelawareDominicanDutchDutch West IndianEastern EuropeanEcuadorianEgyptianEnglishEstonianEthiopianEuropeanFijianFilipinoFinnishFrenchFrench American IndianFrench CanadianGermanGerman RussianGhanaianGreekGuamanian/ChamorroGuatemalanGuyaneseHaitianHmongHonduranHopiHoumaHungarianIcelanderIndian (Asian)IndonesianInupiatIranianIraqiIrishIroquoisIsraeliItalianJamaicanJapaneseJordanianKenyanKiowaKoreanLaotianLatvianLebaneseLiberianLithuanianLumbeeLuxembourgerMacedonianMalaysianMalteseMarshalleseMenomineeMexicanMexican American IndianMongolianMoroccanNative HawaiianNavajoNepaleseNew ZealanderNicaraguanNigerianNorthern EuropeanNorwegianOkinawanOsageOttawaPaiutePakistaniPalestinianPanamanianParaguayanPennsylvania GermanPeruvianPimaPolishPortuguesePotawatomiPuebloPuerto RicanPuget Sound SalishRomanianRussianSalvadoranSamoanScandinavianScotch-IrishScottishSeminoleSenegaleseSerbianShoshoneSierra LeoneanSiouxSlavicSlovakSloveneSomaliSouth AfricanSouth AmericanSouth American IndianSoviet UnionSpaniardSpanishSpanish AmericanSpanish American IndianSri LankanSubsaharan AfricanSudaneseSwedishSwissSyrianTaiwaneseThaiTlingit-HaidaTohono O'OdhamTonganTrinidadian and TobagonianTsimshianTurkishU.S. Virgin IslanderUgandanUkrainianUruguayanUteVenezuelanVietnameseWelshWest IndianYakamaYaquiYugoslavianYumanYup'ikZimbabwean
Immigration
NonimmigrantsImmigrantsAfghanistanAfricaAlbaniaArgentinaArmeniaAsiaAustraliaAustriaBahamasBangladeshBarbadosBelarusBelgiumBelizeBoliviaBosnia and HerzegovinaBrazilBulgariaBurma/MyanmarCabo VerdeCambodiaCameroonCanadaCaribbeanCentral AmericaChileChinaColombiaCongoCosta RicaCroatiaCubaCzechoslovakiaDenmarkDominicaDominican RepublicEastern AfricaEastern AsiaEastern EuropeEcuadorEgyptEl SalvadorEnglandEritreaEthiopiaEuropeFijiFranceGermanyGhanaGreeceGrenadaGuatemalaGuyanaHaitiHondurasHong KongHungaryIndiaIndonesiaIranIraqIrelandIsraelItalyJamaicaJapanJordanKenyaKoreaKuwaitLaosLatin AmericaLatviaLebanonLiberiaLithuaniaMalaysiaMexicoMicronesiaMiddle AfricaMoldovaMoroccoNepalNetherlandsNicaraguaNigeriaNorth AmericaNorth MacedoniaNorthern AfricaNorthern EuropeNorwayOceaniaPakistanPanamaPeruPhilippinesPolandPortugalRomaniaRussiaSaudi ArabiaScotlandSenegalSerbiaSierra LeoneSingaporeSomaliaSouth AfricaSouth AmericaSouth Central AsiaSouth Eastern AsiaSouthern EuropeSpainSri LankaSt. Vincent and the GrenadinesSudanSwedenSwitzerlandSyriaTaiwanThailandTrinidad and TobagoTurkeyUgandaUkraineUruguayUzbekistanVenezuelaVietnamWest IndiesWestern AfricaWestern AsiaWestern EuropeYemenZaireZimbabweAzores
Immigrants from Kazakhstan
Race
Ancestry
AfghanAfricanAlaska NativeAlaskan AthabascanAlbanianAleutAlsatianAmericanApacheArabArapahoArgentineanArmenianAssyrian/Chaldean/SyriacAustralianAustrianBahamianBangladeshiBarbadianBasqueBelgianBelizeanBermudanBhutaneseBlackfeetBolivianBrazilianBritishBritish West IndianBulgarianBurmeseCajunCambodianCanadianCape VerdeanCarpatho RusynCelticCentral AmericanCentral American IndianCherokeeCheyenneChickasawChileanChineseChippewaChoctawColombianColvilleComancheCosta RicanCreeCreekCroatianCrowCubanCypriotCzechCzechoslovakianDanishDelawareDutchDutch West IndianEastern EuropeanEcuadorianEgyptianEnglishEstonianEthiopianEuropeanFijianFilipinoFinnishFrenchFrench American IndianFrench CanadianGermanGerman RussianGhanaianGreekGuamanian/ChamorroGuatemalanGuyaneseHaitianHmongHonduranHopiHoumaHungarianIcelanderIndian (Asian)IndonesianInupiatIranianIraqiIrishIroquoisIsraeliItalianJamaicanJapaneseJordanianKenyanKiowaKoreanLaotianLatvianLebaneseLiberianLithuanianLumbeeLuxembourgerMacedonianMalaysianMalteseMarshalleseMenomineeMexicanMexican American IndianMongolianMoroccanNative HawaiianNavajoNepaleseNew ZealanderNicaraguanNigerianNorthern EuropeanNorwegianOkinawanOsageOttawaPaiutePakistaniPalestinianPanamanianParaguayanPennsylvania GermanPeruvianPimaPolishPortuguesePotawatomiPuebloPuerto RicanPuget Sound SalishRomanianRussianSalvadoranSamoanScandinavianScotch-IrishScottishSeminoleSenegaleseSerbianShoshoneSierra LeoneanSiouxSlavicSlovakSloveneSomaliSouth AfricanSouth AmericanSouth American IndianSoviet UnionSpaniardSpanishSpanish AmericanSpanish American IndianSri LankanSubsaharan AfricanSudaneseSwedishSwissSyrianTaiwaneseThaiTlingit-HaidaTohono O'OdhamTonganTrinidadian and TobagonianTsimshianTurkishU.S. Virgin IslanderUgandanUkrainianUruguayanUteVenezuelanVietnameseWelshWest IndianYakamaYaquiYugoslavianYumanYup'ikZimbabwean
Immigration
NonimmigrantsImmigrantsAfghanistanAfricaAlbaniaArgentinaArmeniaAsiaAustraliaAustriaBahamasBangladeshBarbadosBelarusBelgiumBelizeBoliviaBosnia and HerzegovinaBrazilBulgariaBurma/MyanmarCabo VerdeCambodiaCameroonCanadaCaribbeanCentral AmericaChileChinaColombiaCongoCosta RicaCroatiaCubaCzechoslovakiaDenmarkDominicaDominican RepublicEastern AfricaEastern AsiaEastern EuropeEcuadorEgyptEl SalvadorEnglandEritreaEthiopiaEuropeFijiFranceGermanyGhanaGreeceGrenadaGuatemalaGuyanaHaitiHondurasHong KongHungaryIndiaIndonesiaIranIraqIrelandIsraelItalyJamaicaJapanJordanKazakhstanKenyaKoreaKuwaitLaosLatin AmericaLatviaLebanonLiberiaLithuaniaMalaysiaMexicoMicronesiaMiddle AfricaMoldovaMoroccoNepalNetherlandsNicaraguaNigeriaNorth AmericaNorth MacedoniaNorthern AfricaNorthern EuropeNorwayOceaniaPakistanPanamaPeruPhilippinesPolandPortugalRomaniaRussiaSaudi ArabiaScotlandSenegalSerbiaSierra LeoneSingaporeSomaliaSouth AfricaSouth AmericaSouth Central AsiaSouth Eastern AsiaSouthern EuropeSpainSri LankaSt. Vincent and the GrenadinesSudanSwedenSwitzerlandSyriaTaiwanThailandTrinidad and TobagoTurkeyUgandaUkraineUruguayUzbekistanVenezuelaVietnamWest IndiesWestern AfricaWestern AsiaWestern EuropeYemenZaireZimbabweAzores
Kindergarten
Income
Poverty
Unemployment
Labor Participation
Family Structure
Vehicle Availability
Education Level
Disability

Kindergarten Comparison

Dominicans

Immigrants from Kazakhstan

Tragic
Fair
96.8%
KINDERGARTEN
0.0/ 100
METRIC RATING
326th/ 347
METRIC RANK
97.9%
KINDERGARTEN
35.9/ 100
METRIC RATING
187th/ 347
METRIC RANK

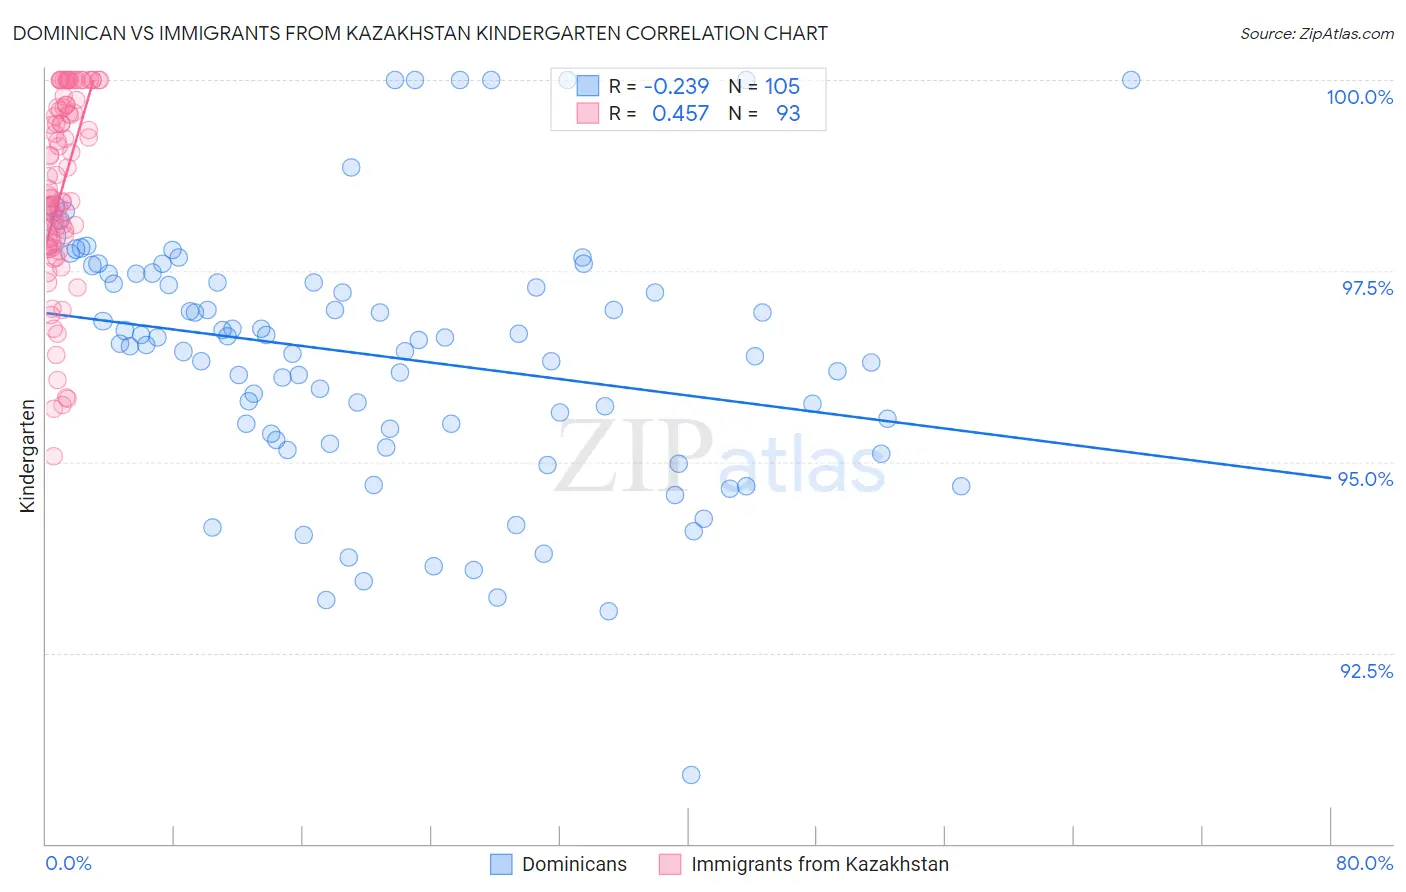
Dominican vs Immigrants from Kazakhstan Kindergarten Correlation Chart

The statistical analysis conducted on geographies consisting of 355,142,603 people shows a weak negative correlation between the proportion of Dominicans and percentage of population with at least kindergarten education in the United States with a correlation coefficient (R) of -0.239 and weighted average of 96.8%. Similarly, the statistical analysis conducted on geographies consisting of 124,444,388 people shows a moderate positive correlation between the proportion of Immigrants from Kazakhstan and percentage of population with at least kindergarten education in the United States with a correlation coefficient (R) of 0.457 and weighted average of 97.9%, a difference of 1.2%.
Dominican vs Immigrants from Kazakhstan Kindergarten

Kindergarten Correlation Summary

MeasurementDominicanImmigrants from Kazakhstan
Minimum90.9%95.1%
Maximum100.0%100.0%
Range9.1%4.9%
Mean96.4%98.6%
Median96.6%98.5%
Interquartile 25% (IQ1)95.3%97.8%
Interquartile 75% (IQ3)97.4%99.6%
Interquartile Range (IQR)2.1%1.8%
Standard Deviation (Sample)1.7%1.2%
Standard Deviation (Population)1.7%1.2%

Similar Demographics by Kindergarten

Demographics Similar to Dominicans by Kindergarten

In terms of kindergarten, the demographic groups most similar to Dominicans are Indonesian (96.8%, a difference of 0.010%), Vietnamese (96.8%, a difference of 0.030%), Immigrants from Honduras (96.8%, a difference of 0.040%), Immigrants from Bangladesh (96.8%, a difference of 0.060%), and Mexican American Indian (96.8%, a difference of 0.060%).
DemographicsRating | RankKindergarten
Immigrants | Guyana
0.0
/100
|
#319
Tragic
96.8%
Immigrants | Burma/Myanmar
0.0
/100
|
#320
Tragic
96.8%
Immigrants | Bangladesh
0.0
/100
|
#321
Tragic
96.8%
Mexican American Indians
0.0
/100
|
#322
Tragic
96.8%
Immigrants | Honduras
0.0
/100
|
#323
Tragic
96.8%
Vietnamese
0.0
/100
|
#324
Tragic
96.8%
Indonesians
0.0
/100
|
#325
Tragic
96.8%
Dominicans
0.0
/100
|
#326
Tragic
96.8%
Mexicans
0.0
/100
|
#327
Tragic
96.7%
Immigrants | Latin America
0.0
/100
|
#328
Tragic
96.7%
Immigrants | Vietnam
0.0
/100
|
#329
Tragic
96.7%
Japanese
0.0
/100
|
#330
Tragic
96.7%
Immigrants | Armenia
0.0
/100
|
#331
Tragic
96.6%
Yakama
0.0
/100
|
#332
Tragic
96.6%
Central Americans
0.0
/100
|
#333
Tragic
96.6%

Demographics Similar to Immigrants from Kazakhstan by Kindergarten

In terms of kindergarten, the demographic groups most similar to Immigrants from Kazakhstan are Pakistani (97.9%, a difference of 0.0%), Arab (97.9%, a difference of 0.0%), Paiute (97.9%, a difference of 0.0%), Immigrants from Belarus (97.9%, a difference of 0.010%), and Panamanian (97.9%, a difference of 0.010%).
DemographicsRating | RankKindergarten
Immigrants | Bosnia and Herzegovina
46.7
/100
|
#180
Average
97.9%
Portuguese
43.5
/100
|
#181
Average
97.9%
Egyptians
42.4
/100
|
#182
Average
97.9%
Immigrants | Poland
41.4
/100
|
#183
Average
97.9%
Immigrants | Argentina
40.7
/100
|
#184
Average
97.9%
Immigrants | Belarus
39.4
/100
|
#185
Fair
97.9%
Pakistanis
36.0
/100
|
#186
Fair
97.9%
Immigrants | Kazakhstan
35.9
/100
|
#187
Fair
97.9%
Arabs
35.4
/100
|
#188
Fair
97.9%
Paiute
34.7
/100
|
#189
Fair
97.9%
Panamanians
33.3
/100
|
#190
Fair
97.9%
Immigrants | Taiwan
30.7
/100
|
#191
Fair
97.9%
Blacks/African Americans
29.9
/100
|
#192
Fair
97.9%
Paraguayans
29.6
/100
|
#193
Fair
97.9%
Hawaiians
29.3
/100
|
#194
Fair
97.9%