Inupiat vs Immigrants from Southern Europe Seniors Poverty Over the Age of 75
COMPARE
Inupiat
Immigrants from Southern Europe
Seniors Poverty Over the Age of 75
Seniors Poverty Over the Age of 75 Comparison
Inupiat
Immigrants from Southern Europe
13.8%
SENIORS POVERTY OVER THE AGE OF 75
0.1/ 100
METRIC RATING
256th/ 347
METRIC RANK
12.7%
SENIORS POVERTY OVER THE AGE OF 75
10.7/ 100
METRIC RATING
203rd/ 347
METRIC RANK
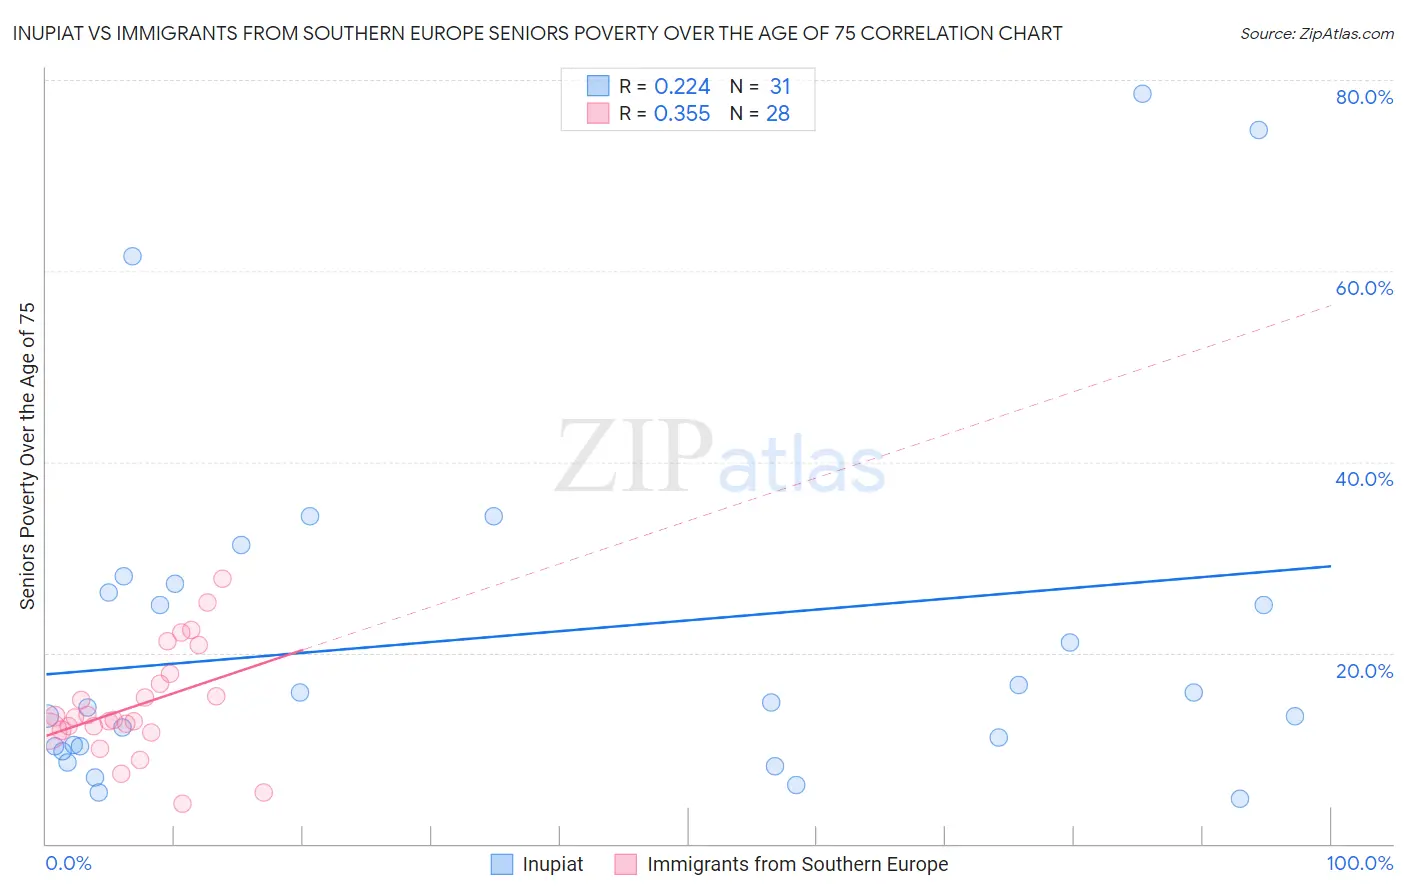
Inupiat vs Immigrants from Southern Europe Seniors Poverty Over the Age of 75 Correlation Chart
The statistical analysis conducted on geographies consisting of 95,812,676 people shows a weak positive correlation between the proportion of Inupiat and poverty level among seniors over the age of 75 in the United States with a correlation coefficient (R) of 0.224 and weighted average of 13.8%. Similarly, the statistical analysis conducted on geographies consisting of 398,215,767 people shows a mild positive correlation between the proportion of Immigrants from Southern Europe and poverty level among seniors over the age of 75 in the United States with a correlation coefficient (R) of 0.355 and weighted average of 12.7%, a difference of 8.8%.
Seniors Poverty Over the Age of 75 Correlation Summary
| Measurement | Inupiat | Immigrants from Southern Europe |
| Minimum | 4.8% | 4.3% |
| Maximum | 78.6% | 27.7% |
| Range | 73.8% | 23.5% |
| Mean | 21.8% | 14.5% |
| Median | 14.8% | 13.1% |
| Interquartile 25% (IQ1) | 10.3% | 11.8% |
| Interquartile 75% (IQ3) | 27.3% | 17.3% |
| Interquartile Range (IQR) | 17.0% | 5.5% |
| Standard Deviation (Sample) | 18.8% | 5.6% |
| Standard Deviation (Population) | 18.5% | 5.5% |
Similar Demographics by Seniors Poverty Over the Age of 75
Demographics Similar to Inupiat by Seniors Poverty Over the Age of 75
In terms of seniors poverty over the age of 75, the demographic groups most similar to Inupiat are Immigrants from Belarus (13.8%, a difference of 0.50%), Immigrants from Western Africa (13.9%, a difference of 0.58%), Immigrants from Panama (13.9%, a difference of 0.67%), Immigrants from Portugal (13.9%, a difference of 0.71%), and Immigrants (13.9%, a difference of 0.78%).
| Demographics | Rating | Rank | Seniors Poverty Over the Age of 75 |
| Immigrants | Albania | 0.3 /100 | #249 | Tragic 13.6% |
| Mexican American Indians | 0.3 /100 | #250 | Tragic 13.6% |
| Immigrants | Peru | 0.3 /100 | #251 | Tragic 13.7% |
| Immigrants | Argentina | 0.3 /100 | #252 | Tragic 13.7% |
| Immigrants | Spain | 0.2 /100 | #253 | Tragic 13.7% |
| Blackfeet | 0.2 /100 | #254 | Tragic 13.7% |
| Immigrants | Belarus | 0.2 /100 | #255 | Tragic 13.8% |
| Inupiat | 0.1 /100 | #256 | Tragic 13.8% |
| Immigrants | Western Africa | 0.1 /100 | #257 | Tragic 13.9% |
| Immigrants | Panama | 0.1 /100 | #258 | Tragic 13.9% |
| Immigrants | Portugal | 0.1 /100 | #259 | Tragic 13.9% |
| Immigrants | Immigrants | 0.1 /100 | #260 | Tragic 13.9% |
| Ghanaians | 0.1 /100 | #261 | Tragic 14.0% |
| Cajuns | 0.1 /100 | #262 | Tragic 14.0% |
| Iroquois | 0.1 /100 | #263 | Tragic 14.0% |
Demographics Similar to Immigrants from Southern Europe by Seniors Poverty Over the Age of 75
In terms of seniors poverty over the age of 75, the demographic groups most similar to Immigrants from Southern Europe are Immigrants from Eritrea (12.7%, a difference of 0.030%), Arapaho (12.7%, a difference of 0.060%), Paraguayan (12.7%, a difference of 0.090%), Indian (Asian) (12.7%, a difference of 0.19%), and Albanian (12.7%, a difference of 0.23%).
| Demographics | Rating | Rank | Seniors Poverty Over the Age of 75 |
| Immigrants | Eastern Europe | 16.0 /100 | #196 | Poor 12.6% |
| Nepalese | 14.4 /100 | #197 | Poor 12.6% |
| Chileans | 13.7 /100 | #198 | Poor 12.6% |
| Immigrants | Lebanon | 12.7 /100 | #199 | Poor 12.7% |
| Immigrants | Vietnam | 12.1 /100 | #200 | Poor 12.7% |
| Paraguayans | 11.1 /100 | #201 | Poor 12.7% |
| Arapaho | 10.9 /100 | #202 | Poor 12.7% |
| Immigrants | Southern Europe | 10.7 /100 | #203 | Poor 12.7% |
| Immigrants | Eritrea | 10.5 /100 | #204 | Poor 12.7% |
| Indians (Asian) | 9.7 /100 | #205 | Tragic 12.7% |
| Albanians | 9.6 /100 | #206 | Tragic 12.7% |
| Costa Ricans | 8.7 /100 | #207 | Tragic 12.8% |
| Immigrants | Eastern Asia | 8.4 /100 | #208 | Tragic 12.8% |
| Immigrants | Liberia | 7.3 /100 | #209 | Tragic 12.8% |
| Comanche | 7.0 /100 | #210 | Tragic 12.8% |