Danish vs Immigrants from Czechoslovakia Child Poverty Among Girls Under 16
COMPARE
Danish
Immigrants from Czechoslovakia
Child Poverty Among Girls Under 16
Child Poverty Among Girls Under 16 Comparison
Danes
Immigrants from Czechoslovakia
13.7%
CHILD POVERTY AMONG GIRLS UNDER 16
99.7/ 100
METRIC RATING
32nd/ 347
METRIC RANK
14.2%
CHILD POVERTY AMONG GIRLS UNDER 16
99.3/ 100
METRIC RATING
47th/ 347
METRIC RANK
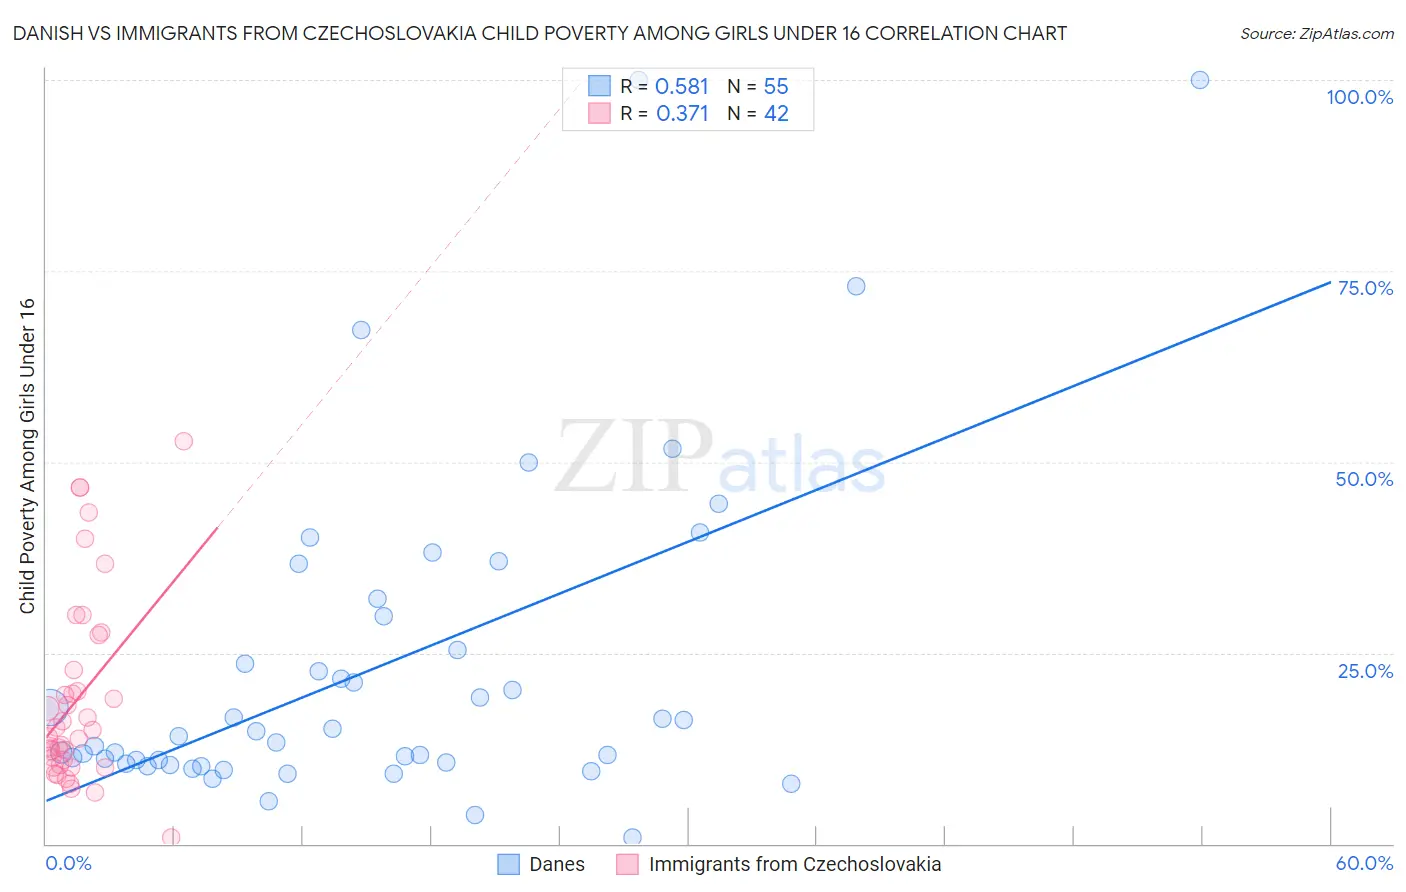
Danish vs Immigrants from Czechoslovakia Child Poverty Among Girls Under 16 Correlation Chart
The statistical analysis conducted on geographies consisting of 460,459,007 people shows a substantial positive correlation between the proportion of Danes and poverty level among girls under the age of 16 in the United States with a correlation coefficient (R) of 0.581 and weighted average of 13.7%. Similarly, the statistical analysis conducted on geographies consisting of 192,771,534 people shows a mild positive correlation between the proportion of Immigrants from Czechoslovakia and poverty level among girls under the age of 16 in the United States with a correlation coefficient (R) of 0.371 and weighted average of 14.2%, a difference of 3.3%.
Child Poverty Among Girls Under 16 Correlation Summary
| Measurement | Danish | Immigrants from Czechoslovakia |
| Minimum | 0.79% | 0.88% |
| Maximum | 100.0% | 52.8% |
| Range | 99.2% | 51.9% |
| Mean | 23.1% | 18.9% |
| Median | 14.1% | 14.4% |
| Interquartile 25% (IQ1) | 10.5% | 10.3% |
| Interquartile 75% (IQ3) | 29.7% | 22.7% |
| Interquartile Range (IQR) | 19.2% | 12.4% |
| Standard Deviation (Sample) | 21.5% | 12.4% |
| Standard Deviation (Population) | 21.3% | 12.2% |
Demographics Similar to Danes and Immigrants from Czechoslovakia by Child Poverty Among Girls Under 16
In terms of child poverty among girls under 16, the demographic groups most similar to Danes are Swedish (13.7%, a difference of 0.030%), Turkish (13.7%, a difference of 0.040%), Maltese (13.7%, a difference of 0.080%), Asian (13.7%, a difference of 0.16%), and Bolivian (13.6%, a difference of 0.83%). Similarly, the demographic groups most similar to Immigrants from Czechoslovakia are Czech (14.2%, a difference of 0.020%), Croatian (14.1%, a difference of 0.030%), Immigrants from Greece (14.1%, a difference of 0.060%), Greek (14.2%, a difference of 0.060%), and Immigrants from Asia (14.1%, a difference of 0.56%).
| Demographics | Rating | Rank | Child Poverty Among Girls Under 16 |
| Bolivians | 99.8 /100 | #29 | Exceptional 13.6% |
| Asians | 99.7 /100 | #30 | Exceptional 13.7% |
| Turks | 99.7 /100 | #31 | Exceptional 13.7% |
| Danes | 99.7 /100 | #32 | Exceptional 13.7% |
| Swedes | 99.7 /100 | #33 | Exceptional 13.7% |
| Maltese | 99.7 /100 | #34 | Exceptional 13.7% |
| Immigrants | Northern Europe | 99.6 /100 | #35 | Exceptional 13.8% |
| Russians | 99.6 /100 | #36 | Exceptional 13.9% |
| Lithuanians | 99.6 /100 | #37 | Exceptional 13.9% |
| Immigrants | Moldova | 99.6 /100 | #38 | Exceptional 13.9% |
| Immigrants | Australia | 99.5 /100 | #39 | Exceptional 14.0% |
| Immigrants | Sri Lanka | 99.5 /100 | #40 | Exceptional 14.0% |
| Immigrants | Bolivia | 99.5 /100 | #41 | Exceptional 14.0% |
| Immigrants | Scotland | 99.4 /100 | #42 | Exceptional 14.0% |
| Koreans | 99.4 /100 | #43 | Exceptional 14.1% |
| Immigrants | Asia | 99.4 /100 | #44 | Exceptional 14.1% |
| Immigrants | Greece | 99.3 /100 | #45 | Exceptional 14.1% |
| Croatians | 99.3 /100 | #46 | Exceptional 14.1% |
| Immigrants | Czechoslovakia | 99.3 /100 | #47 | Exceptional 14.2% |
| Czechs | 99.3 /100 | #48 | Exceptional 14.2% |
| Greeks | 99.2 /100 | #49 | Exceptional 14.2% |