Immigrants from Western Europe vs Immigrants from Argentina Seniors Poverty Over the Age of 75
COMPARE
Immigrants from Western Europe
Immigrants from Argentina
Seniors Poverty Over the Age of 75
Seniors Poverty Over the Age of 75 Comparison
Immigrants from Western Europe
Immigrants from Argentina
11.9%
SENIORS POVERTY OVER THE AGE OF 75
79.6/ 100
METRIC RATING
131st/ 347
METRIC RANK
13.7%
SENIORS POVERTY OVER THE AGE OF 75
0.3/ 100
METRIC RATING
252nd/ 347
METRIC RANK
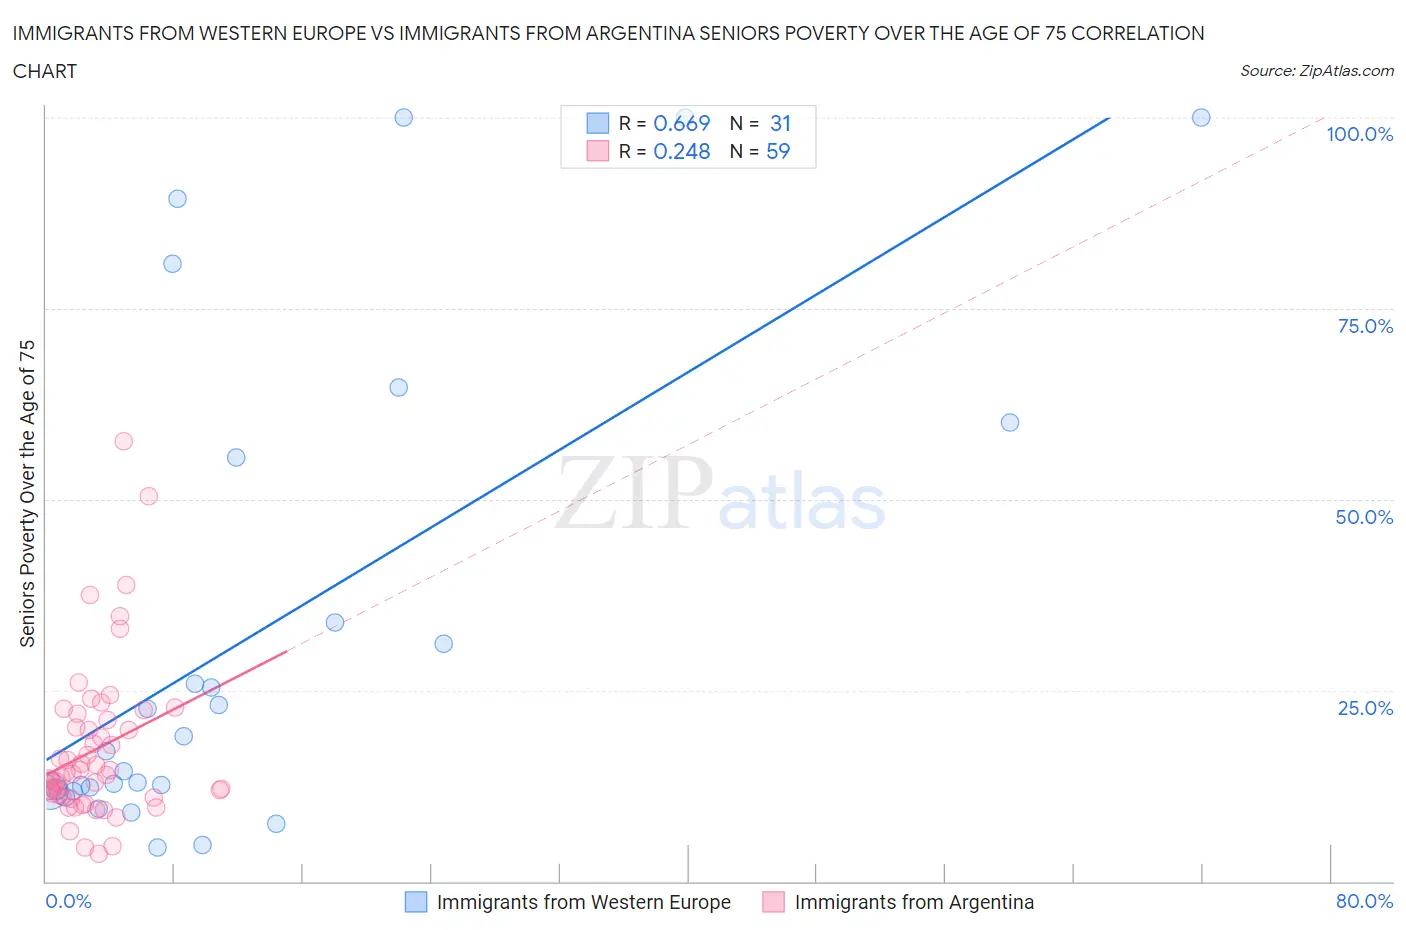
Immigrants from Western Europe vs Immigrants from Argentina Seniors Poverty Over the Age of 75 Correlation Chart
The statistical analysis conducted on geographies consisting of 485,519,113 people shows a significant positive correlation between the proportion of Immigrants from Western Europe and poverty level among seniors over the age of 75 in the United States with a correlation coefficient (R) of 0.669 and weighted average of 11.9%. Similarly, the statistical analysis conducted on geographies consisting of 262,394,450 people shows a weak positive correlation between the proportion of Immigrants from Argentina and poverty level among seniors over the age of 75 in the United States with a correlation coefficient (R) of 0.248 and weighted average of 13.7%, a difference of 15.3%.
Seniors Poverty Over the Age of 75 Correlation Summary
| Measurement | Immigrants from Western Europe | Immigrants from Argentina |
| Minimum | 4.4% | 3.5% |
| Maximum | 100.0% | 57.7% |
| Range | 95.6% | 54.2% |
| Mean | 32.5% | 17.2% |
| Median | 17.0% | 14.2% |
| Interquartile 25% (IQ1) | 11.8% | 11.0% |
| Interquartile 75% (IQ3) | 55.6% | 21.1% |
| Interquartile Range (IQR) | 43.7% | 10.0% |
| Standard Deviation (Sample) | 31.4% | 10.3% |
| Standard Deviation (Population) | 30.9% | 10.2% |
Similar Demographics by Seniors Poverty Over the Age of 75
Demographics Similar to Immigrants from Western Europe by Seniors Poverty Over the Age of 75
In terms of seniors poverty over the age of 75, the demographic groups most similar to Immigrants from Western Europe are Spanish (11.8%, a difference of 0.12%), Ethiopian (11.8%, a difference of 0.14%), Lebanese (11.9%, a difference of 0.16%), Immigrants from Sierra Leone (11.9%, a difference of 0.25%), and Immigrants from Hungary (11.8%, a difference of 0.28%).
| Demographics | Rating | Rank | Seniors Poverty Over the Age of 75 |
| Fijians | 83.8 /100 | #124 | Excellent 11.8% |
| Sudanese | 83.6 /100 | #125 | Excellent 11.8% |
| Pennsylvania Germans | 83.4 /100 | #126 | Excellent 11.8% |
| Immigrants | Denmark | 82.6 /100 | #127 | Excellent 11.8% |
| Immigrants | Hungary | 81.7 /100 | #128 | Excellent 11.8% |
| Ethiopians | 80.7 /100 | #129 | Excellent 11.8% |
| Spanish | 80.5 /100 | #130 | Excellent 11.8% |
| Immigrants | Western Europe | 79.6 /100 | #131 | Good 11.9% |
| Lebanese | 78.3 /100 | #132 | Good 11.9% |
| Immigrants | Sierra Leone | 77.6 /100 | #133 | Good 11.9% |
| Ugandans | 77.1 /100 | #134 | Good 11.9% |
| Immigrants | Ireland | 76.2 /100 | #135 | Good 11.9% |
| Immigrants | Philippines | 75.0 /100 | #136 | Good 11.9% |
| Immigrants | Moldova | 74.1 /100 | #137 | Good 11.9% |
| Immigrants | Romania | 72.6 /100 | #138 | Good 11.9% |
Demographics Similar to Immigrants from Argentina by Seniors Poverty Over the Age of 75
In terms of seniors poverty over the age of 75, the demographic groups most similar to Immigrants from Argentina are Immigrants from Peru (13.7%, a difference of 0.050%), Immigrants from Spain (13.7%, a difference of 0.22%), Blackfeet (13.7%, a difference of 0.33%), Mexican American Indian (13.6%, a difference of 0.38%), and Immigrants from Albania (13.6%, a difference of 0.39%).
| Demographics | Rating | Rank | Seniors Poverty Over the Age of 75 |
| Uruguayans | 0.5 /100 | #245 | Tragic 13.5% |
| Immigrants | Cambodia | 0.4 /100 | #246 | Tragic 13.6% |
| Immigrants | Ukraine | 0.3 /100 | #247 | Tragic 13.6% |
| Africans | 0.3 /100 | #248 | Tragic 13.6% |
| Immigrants | Albania | 0.3 /100 | #249 | Tragic 13.6% |
| Mexican American Indians | 0.3 /100 | #250 | Tragic 13.6% |
| Immigrants | Peru | 0.3 /100 | #251 | Tragic 13.7% |
| Immigrants | Argentina | 0.3 /100 | #252 | Tragic 13.7% |
| Immigrants | Spain | 0.2 /100 | #253 | Tragic 13.7% |
| Blackfeet | 0.2 /100 | #254 | Tragic 13.7% |
| Immigrants | Belarus | 0.2 /100 | #255 | Tragic 13.8% |
| Inupiat | 0.1 /100 | #256 | Tragic 13.8% |
| Immigrants | Western Africa | 0.1 /100 | #257 | Tragic 13.9% |
| Immigrants | Panama | 0.1 /100 | #258 | Tragic 13.9% |
| Immigrants | Portugal | 0.1 /100 | #259 | Tragic 13.9% |