Immigrants from Nigeria vs Houma Seniors Poverty Over the Age of 75
COMPARE
Immigrants from Nigeria
Houma
Seniors Poverty Over the Age of 75
Seniors Poverty Over the Age of 75 Comparison
Immigrants from Nigeria
Houma
13.0%
SENIORS POVERTY OVER THE AGE OF 75
3.3/ 100
METRIC RATING
223rd/ 347
METRIC RANK
16.2%
SENIORS POVERTY OVER THE AGE OF 75
0.0/ 100
METRIC RATING
318th/ 347
METRIC RANK
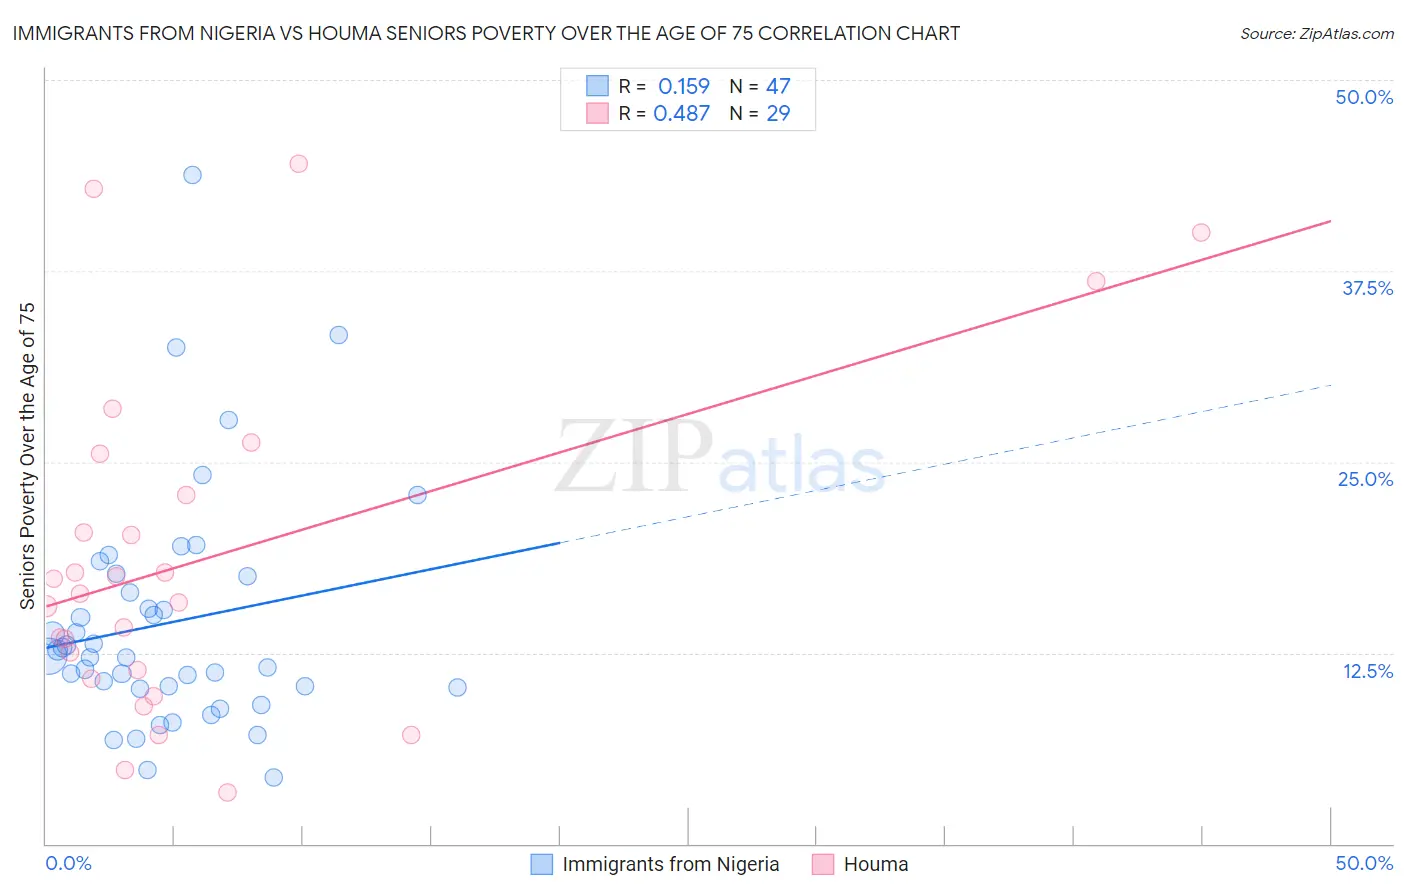
Immigrants from Nigeria vs Houma Seniors Poverty Over the Age of 75 Correlation Chart
The statistical analysis conducted on geographies consisting of 281,265,931 people shows a poor positive correlation between the proportion of Immigrants from Nigeria and poverty level among seniors over the age of 75 in the United States with a correlation coefficient (R) of 0.159 and weighted average of 13.0%. Similarly, the statistical analysis conducted on geographies consisting of 36,627,253 people shows a moderate positive correlation between the proportion of Houma and poverty level among seniors over the age of 75 in the United States with a correlation coefficient (R) of 0.487 and weighted average of 16.2%, a difference of 24.7%.
Seniors Poverty Over the Age of 75 Correlation Summary
| Measurement | Immigrants from Nigeria | Houma |
| Minimum | 4.3% | 3.3% |
| Maximum | 43.8% | 44.5% |
| Range | 39.5% | 41.2% |
| Mean | 14.5% | 18.7% |
| Median | 12.2% | 16.4% |
| Interquartile 25% (IQ1) | 10.2% | 11.1% |
| Interquartile 75% (IQ3) | 17.5% | 24.2% |
| Interquartile Range (IQR) | 7.3% | 13.1% |
| Standard Deviation (Sample) | 7.7% | 11.0% |
| Standard Deviation (Population) | 7.6% | 10.8% |
Similar Demographics by Seniors Poverty Over the Age of 75
Demographics Similar to Immigrants from Nigeria by Seniors Poverty Over the Age of 75
In terms of seniors poverty over the age of 75, the demographic groups most similar to Immigrants from Nigeria are Nigerian (13.0%, a difference of 0.090%), Chippewa (13.1%, a difference of 0.20%), Immigrants from Morocco (13.1%, a difference of 0.27%), Shoshone (13.1%, a difference of 0.43%), and Immigrants from Kazakhstan (13.0%, a difference of 0.53%).
| Demographics | Rating | Rank | Seniors Poverty Over the Age of 75 |
| Immigrants | Brazil | 5.2 /100 | #216 | Tragic 12.9% |
| Bermudans | 4.9 /100 | #217 | Tragic 12.9% |
| Immigrants | Western Asia | 4.9 /100 | #218 | Tragic 12.9% |
| Ute | 4.7 /100 | #219 | Tragic 12.9% |
| Seminole | 4.5 /100 | #220 | Tragic 12.9% |
| Immigrants | Kazakhstan | 4.3 /100 | #221 | Tragic 13.0% |
| Nigerians | 3.4 /100 | #222 | Tragic 13.0% |
| Immigrants | Nigeria | 3.3 /100 | #223 | Tragic 13.0% |
| Chippewa | 2.9 /100 | #224 | Tragic 13.1% |
| Immigrants | Morocco | 2.8 /100 | #225 | Tragic 13.1% |
| Shoshone | 2.6 /100 | #226 | Tragic 13.1% |
| Cree | 2.3 /100 | #227 | Tragic 13.1% |
| Israelis | 2.0 /100 | #228 | Tragic 13.2% |
| Somalis | 1.6 /100 | #229 | Tragic 13.2% |
| Immigrants | China | 1.5 /100 | #230 | Tragic 13.2% |
Demographics Similar to Houma by Seniors Poverty Over the Age of 75
In terms of seniors poverty over the age of 75, the demographic groups most similar to Houma are Haitian (16.2%, a difference of 0.040%), Immigrants from Guyana (16.2%, a difference of 0.13%), Immigrants from Ecuador (16.1%, a difference of 0.74%), Guyanese (16.1%, a difference of 0.75%), and Tsimshian (16.1%, a difference of 1.1%).
| Demographics | Rating | Rank | Seniors Poverty Over the Age of 75 |
| Trinidadians and Tobagonians | 0.0 /100 | #311 | Tragic 15.9% |
| Crow | 0.0 /100 | #312 | Tragic 15.9% |
| Barbadians | 0.0 /100 | #313 | Tragic 16.0% |
| Tsimshian | 0.0 /100 | #314 | Tragic 16.1% |
| Guyanese | 0.0 /100 | #315 | Tragic 16.1% |
| Immigrants | Ecuador | 0.0 /100 | #316 | Tragic 16.1% |
| Immigrants | Guyana | 0.0 /100 | #317 | Tragic 16.2% |
| Houma | 0.0 /100 | #318 | Tragic 16.2% |
| Haitians | 0.0 /100 | #319 | Tragic 16.2% |
| Immigrants | Yemen | 0.0 /100 | #320 | Tragic 16.5% |
| Immigrants | Haiti | 0.0 /100 | #321 | Tragic 16.5% |
| Immigrants | Barbados | 0.0 /100 | #322 | Tragic 16.5% |
| Central American Indians | 0.0 /100 | #323 | Tragic 16.5% |
| Immigrants | Uzbekistan | 0.0 /100 | #324 | Tragic 16.5% |
| Nicaraguans | 0.0 /100 | #325 | Tragic 16.6% |