Crow vs Portuguese Seniors Poverty Over the Age of 75
COMPARE
Crow
Portuguese
Seniors Poverty Over the Age of 75
Seniors Poverty Over the Age of 75 Comparison
Crow
Portuguese
15.9%
SENIORS POVERTY OVER THE AGE OF 75
0.0/ 100
METRIC RATING
312th/ 347
METRIC RANK
12.1%
SENIORS POVERTY OVER THE AGE OF 75
61.3/ 100
METRIC RATING
158th/ 347
METRIC RANK
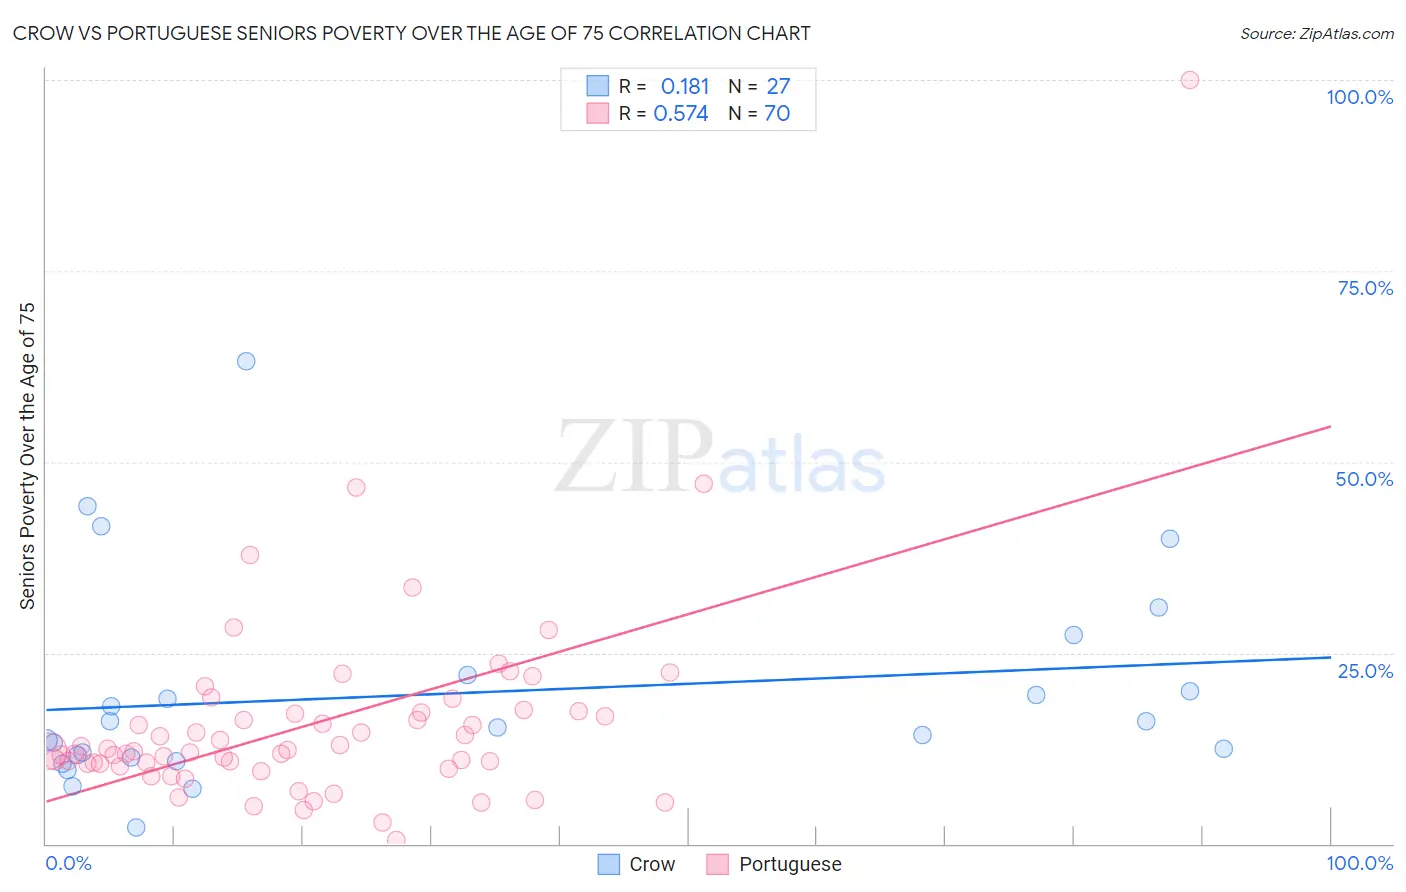
Crow vs Portuguese Seniors Poverty Over the Age of 75 Correlation Chart
The statistical analysis conducted on geographies consisting of 58,947,142 people shows a poor positive correlation between the proportion of Crow and poverty level among seniors over the age of 75 in the United States with a correlation coefficient (R) of 0.181 and weighted average of 15.9%. Similarly, the statistical analysis conducted on geographies consisting of 442,883,774 people shows a substantial positive correlation between the proportion of Portuguese and poverty level among seniors over the age of 75 in the United States with a correlation coefficient (R) of 0.574 and weighted average of 12.1%, a difference of 32.0%.
Seniors Poverty Over the Age of 75 Correlation Summary
| Measurement | Crow | Portuguese |
| Minimum | 2.2% | 0.48% |
| Maximum | 63.2% | 100.0% |
| Range | 61.0% | 99.5% |
| Mean | 19.6% | 15.8% |
| Median | 15.3% | 12.2% |
| Interquartile 25% (IQ1) | 11.2% | 10.5% |
| Interquartile 75% (IQ3) | 22.1% | 17.1% |
| Interquartile Range (IQR) | 10.9% | 6.7% |
| Standard Deviation (Sample) | 13.7% | 13.4% |
| Standard Deviation (Population) | 13.4% | 13.3% |
Similar Demographics by Seniors Poverty Over the Age of 75
Demographics Similar to Crow by Seniors Poverty Over the Age of 75
In terms of seniors poverty over the age of 75, the demographic groups most similar to Crow are Trinidadian and Tobagonian (15.9%, a difference of 0.41%), Barbadian (16.0%, a difference of 0.47%), Vietnamese (15.9%, a difference of 0.51%), Yup'ik (15.8%, a difference of 0.61%), and Tsimshian (16.1%, a difference of 0.83%).
| Demographics | Rating | Rank | Seniors Poverty Over the Age of 75 |
| Ecuadorians | 0.0 /100 | #305 | Tragic 15.7% |
| Hispanics or Latinos | 0.0 /100 | #306 | Tragic 15.8% |
| Immigrants | West Indies | 0.0 /100 | #307 | Tragic 15.8% |
| Immigrants | Bangladesh | 0.0 /100 | #308 | Tragic 15.8% |
| Yup'ik | 0.0 /100 | #309 | Tragic 15.8% |
| Vietnamese | 0.0 /100 | #310 | Tragic 15.9% |
| Trinidadians and Tobagonians | 0.0 /100 | #311 | Tragic 15.9% |
| Crow | 0.0 /100 | #312 | Tragic 15.9% |
| Barbadians | 0.0 /100 | #313 | Tragic 16.0% |
| Tsimshian | 0.0 /100 | #314 | Tragic 16.1% |
| Guyanese | 0.0 /100 | #315 | Tragic 16.1% |
| Immigrants | Ecuador | 0.0 /100 | #316 | Tragic 16.1% |
| Immigrants | Guyana | 0.0 /100 | #317 | Tragic 16.2% |
| Houma | 0.0 /100 | #318 | Tragic 16.2% |
| Haitians | 0.0 /100 | #319 | Tragic 16.2% |
Demographics Similar to Portuguese by Seniors Poverty Over the Age of 75
In terms of seniors poverty over the age of 75, the demographic groups most similar to Portuguese are Immigrants from Middle Africa (12.1%, a difference of 0.010%), Immigrants from Eastern Africa (12.1%, a difference of 0.030%), Immigrants from Sudan (12.1%, a difference of 0.040%), Immigrants from Norway (12.1%, a difference of 0.060%), and Immigrants from Burma/Myanmar (12.1%, a difference of 0.090%).
| Demographics | Rating | Rank | Seniors Poverty Over the Age of 75 |
| Cherokee | 65.8 /100 | #151 | Good 12.0% |
| Immigrants | Korea | 65.5 /100 | #152 | Good 12.0% |
| Immigrants | Turkey | 64.7 /100 | #153 | Good 12.0% |
| Cambodians | 64.0 /100 | #154 | Good 12.0% |
| Indonesians | 62.6 /100 | #155 | Good 12.1% |
| Immigrants | Burma/Myanmar | 62.3 /100 | #156 | Good 12.1% |
| Immigrants | Sudan | 61.7 /100 | #157 | Good 12.1% |
| Portuguese | 61.3 /100 | #158 | Good 12.1% |
| Immigrants | Middle Africa | 61.2 /100 | #159 | Good 12.1% |
| Immigrants | Eastern Africa | 60.9 /100 | #160 | Good 12.1% |
| Immigrants | Norway | 60.6 /100 | #161 | Good 12.1% |
| Immigrants | Serbia | 60.2 /100 | #162 | Good 12.1% |
| Immigrants | Greece | 58.2 /100 | #163 | Average 12.1% |
| Potawatomi | 57.4 /100 | #164 | Average 12.1% |
| Okinawans | 56.3 /100 | #165 | Average 12.1% |