Immigrants from Malaysia vs Cherokee Female Poverty Among 18-24 Year Olds
COMPARE
Immigrants from Malaysia
Cherokee
Female Poverty Among 18-24 Year Olds
Female Poverty Among 18-24 Year Olds Comparison
Immigrants from Malaysia
Cherokee
20.5%
FEMALE POVERTY AMONG 18-24 YEAR OLDS
17.2/ 100
METRIC RATING
203rd/ 347
METRIC RANK
22.7%
FEMALE POVERTY AMONG 18-24 YEAR OLDS
0.0/ 100
METRIC RATING
299th/ 347
METRIC RANK
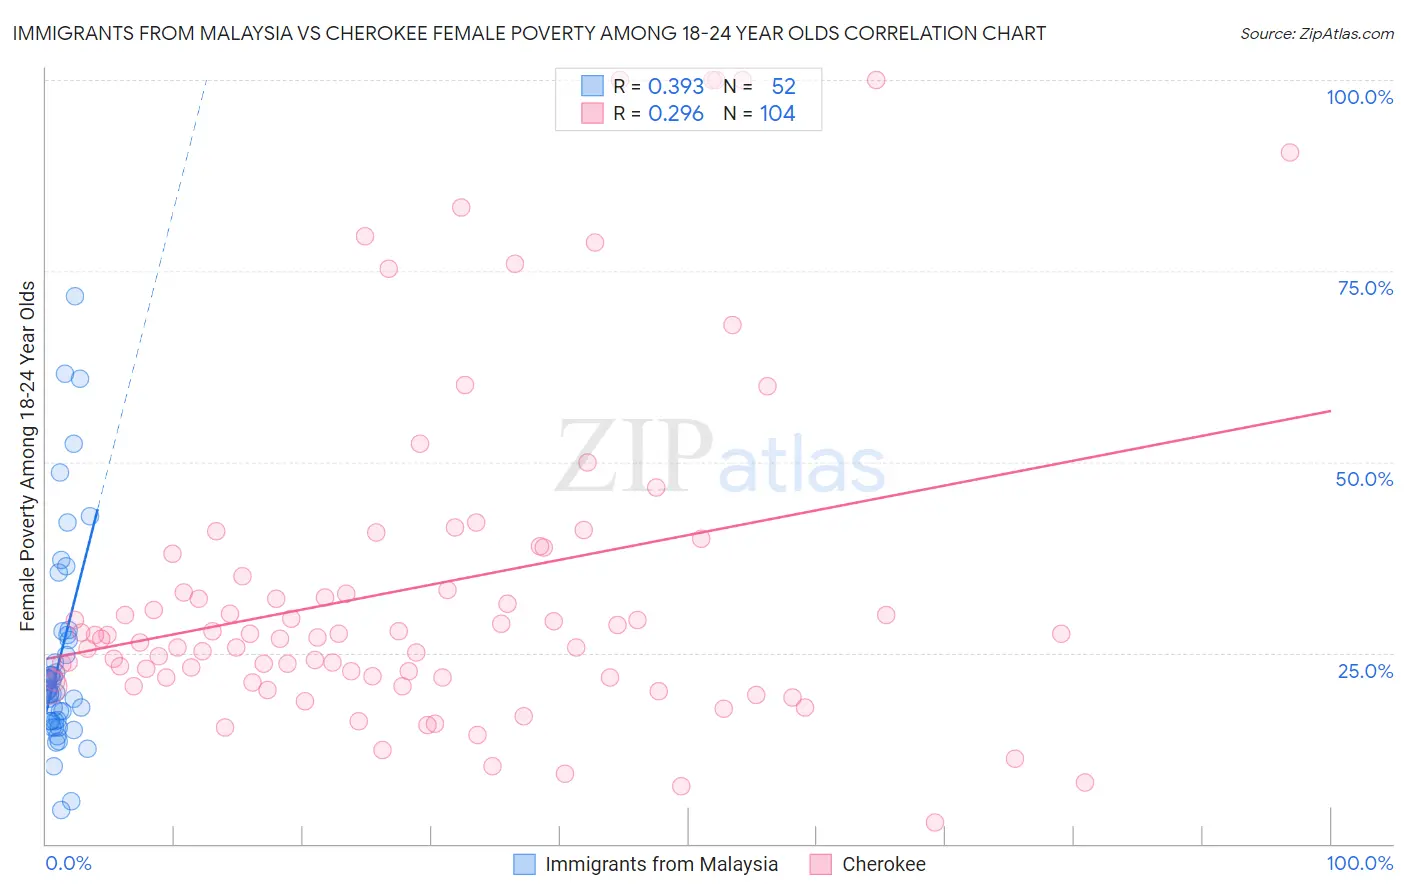
Immigrants from Malaysia vs Cherokee Female Poverty Among 18-24 Year Olds Correlation Chart
The statistical analysis conducted on geographies consisting of 195,617,735 people shows a mild positive correlation between the proportion of Immigrants from Malaysia and poverty level among females between the ages 18 and 24 in the United States with a correlation coefficient (R) of 0.393 and weighted average of 20.5%. Similarly, the statistical analysis conducted on geographies consisting of 476,487,682 people shows a weak positive correlation between the proportion of Cherokee and poverty level among females between the ages 18 and 24 in the United States with a correlation coefficient (R) of 0.296 and weighted average of 22.7%, a difference of 10.7%.
Female Poverty Among 18-24 Year Olds Correlation Summary
| Measurement | Immigrants from Malaysia | Cherokee |
| Minimum | 4.5% | 2.7% |
| Maximum | 71.6% | 100.0% |
| Range | 67.2% | 97.3% |
| Mean | 24.4% | 33.7% |
| Median | 20.1% | 27.2% |
| Interquartile 25% (IQ1) | 16.1% | 21.8% |
| Interquartile 75% (IQ3) | 27.0% | 36.5% |
| Interquartile Range (IQR) | 10.9% | 14.8% |
| Standard Deviation (Sample) | 14.0% | 22.2% |
| Standard Deviation (Population) | 13.8% | 22.1% |
Similar Demographics by Female Poverty Among 18-24 Year Olds
Demographics Similar to Immigrants from Malaysia by Female Poverty Among 18-24 Year Olds
In terms of female poverty among 18-24 year olds, the demographic groups most similar to Immigrants from Malaysia are Immigrants from Netherlands (20.5%, a difference of 0.020%), Immigrants from Turkey (20.5%, a difference of 0.040%), English (20.5%, a difference of 0.040%), Hispanic or Latino (20.5%, a difference of 0.050%), and Spaniard (20.5%, a difference of 0.070%).
| Demographics | Rating | Rank | Female Poverty Among 18-24 Year Olds |
| Czechs | 22.3 /100 | #196 | Fair 20.4% |
| Zimbabweans | 21.0 /100 | #197 | Fair 20.4% |
| Immigrants | Spain | 20.7 /100 | #198 | Fair 20.4% |
| Germans | 20.6 /100 | #199 | Fair 20.4% |
| Europeans | 19.9 /100 | #200 | Poor 20.4% |
| Mexicans | 18.3 /100 | #201 | Poor 20.5% |
| Immigrants | Turkey | 17.7 /100 | #202 | Poor 20.5% |
| Immigrants | Malaysia | 17.2 /100 | #203 | Poor 20.5% |
| Immigrants | Netherlands | 17.0 /100 | #204 | Poor 20.5% |
| English | 16.7 /100 | #205 | Poor 20.5% |
| Hispanics or Latinos | 16.6 /100 | #206 | Poor 20.5% |
| Spaniards | 16.3 /100 | #207 | Poor 20.5% |
| Dutch | 15.9 /100 | #208 | Poor 20.5% |
| Arabs | 15.5 /100 | #209 | Poor 20.5% |
| Immigrants | Ghana | 14.3 /100 | #210 | Poor 20.5% |
Demographics Similar to Cherokee by Female Poverty Among 18-24 Year Olds
In terms of female poverty among 18-24 year olds, the demographic groups most similar to Cherokee are Central American Indian (22.6%, a difference of 0.41%), Inupiat (22.6%, a difference of 0.47%), Menominee (22.5%, a difference of 0.62%), Shoshone (22.5%, a difference of 0.72%), and African (22.8%, a difference of 0.72%).
| Demographics | Rating | Rank | Female Poverty Among 18-24 Year Olds |
| Alaskan Athabascans | 0.0 /100 | #292 | Tragic 22.5% |
| U.S. Virgin Islanders | 0.0 /100 | #293 | Tragic 22.5% |
| Indonesians | 0.0 /100 | #294 | Tragic 22.5% |
| Shoshone | 0.0 /100 | #295 | Tragic 22.5% |
| Menominee | 0.0 /100 | #296 | Tragic 22.5% |
| Inupiat | 0.0 /100 | #297 | Tragic 22.6% |
| Central American Indians | 0.0 /100 | #298 | Tragic 22.6% |
| Cherokee | 0.0 /100 | #299 | Tragic 22.7% |
| Africans | 0.0 /100 | #300 | Tragic 22.8% |
| Seminole | 0.0 /100 | #301 | Tragic 22.9% |
| Iroquois | 0.0 /100 | #302 | Tragic 22.9% |
| Senegalese | 0.0 /100 | #303 | Tragic 23.0% |
| Sudanese | 0.0 /100 | #304 | Tragic 23.0% |
| Immigrants | Kuwait | 0.0 /100 | #305 | Tragic 23.0% |
| Paiute | 0.0 /100 | #306 | Tragic 23.3% |