Creek vs Immigrants from Belize Seniors Poverty Over the Age of 75
COMPARE
Creek
Immigrants from Belize
Seniors Poverty Over the Age of 75
Seniors Poverty Over the Age of 75 Comparison
Creek
Immigrants from Belize
11.6%
SENIORS POVERTY OVER THE AGE OF 75
92.7/ 100
METRIC RATING
94th/ 347
METRIC RANK
15.2%
SENIORS POVERTY OVER THE AGE OF 75
0.0/ 100
METRIC RATING
289th/ 347
METRIC RANK
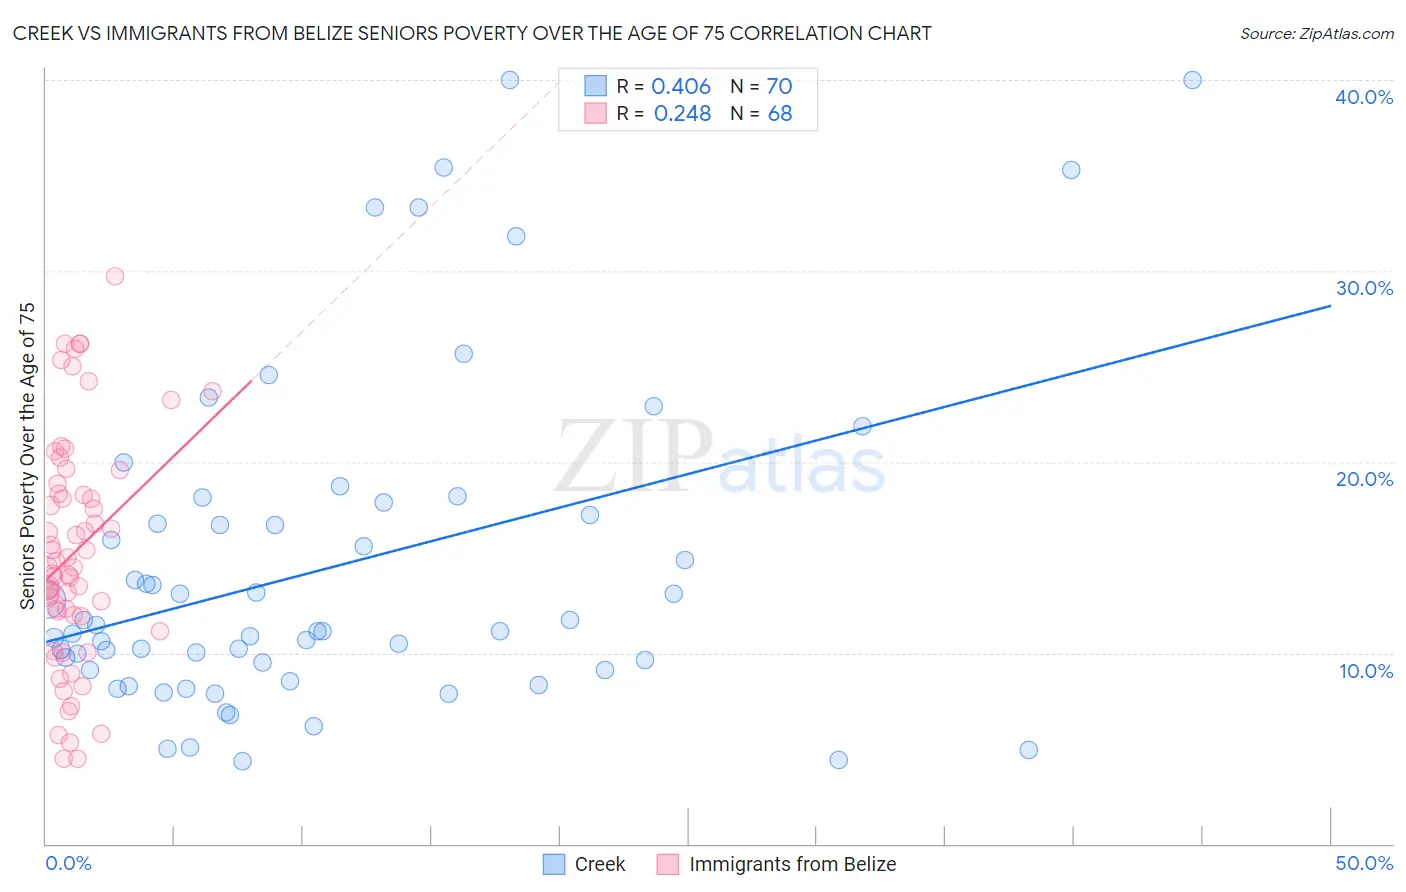
Creek vs Immigrants from Belize Seniors Poverty Over the Age of 75 Correlation Chart
The statistical analysis conducted on geographies consisting of 177,296,748 people shows a moderate positive correlation between the proportion of Creek and poverty level among seniors over the age of 75 in the United States with a correlation coefficient (R) of 0.406 and weighted average of 11.6%. Similarly, the statistical analysis conducted on geographies consisting of 129,999,038 people shows a weak positive correlation between the proportion of Immigrants from Belize and poverty level among seniors over the age of 75 in the United States with a correlation coefficient (R) of 0.248 and weighted average of 15.2%, a difference of 31.4%.
Seniors Poverty Over the Age of 75 Correlation Summary
| Measurement | Creek | Immigrants from Belize |
| Minimum | 4.3% | 4.4% |
| Maximum | 40.0% | 29.7% |
| Range | 35.7% | 25.3% |
| Mean | 14.5% | 15.3% |
| Median | 11.1% | 14.5% |
| Interquartile 25% (IQ1) | 9.1% | 12.0% |
| Interquartile 75% (IQ3) | 17.2% | 18.6% |
| Interquartile Range (IQR) | 8.1% | 6.6% |
| Standard Deviation (Sample) | 8.6% | 5.9% |
| Standard Deviation (Population) | 8.5% | 5.9% |
Similar Demographics by Seniors Poverty Over the Age of 75
Demographics Similar to Creek by Seniors Poverty Over the Age of 75
In terms of seniors poverty over the age of 75, the demographic groups most similar to Creek are Immigrants from Bosnia and Herzegovina (11.6%, a difference of 0.040%), Immigrants from Sweden (11.6%, a difference of 0.040%), Immigrants from Poland (11.6%, a difference of 0.050%), Romanian (11.6%, a difference of 0.13%), and Immigrants from Japan (11.6%, a difference of 0.24%).
| Demographics | Rating | Rank | Seniors Poverty Over the Age of 75 |
| Koreans | 94.5 /100 | #87 | Exceptional 11.5% |
| Immigrants | Croatia | 94.5 /100 | #88 | Exceptional 11.5% |
| Immigrants | Sri Lanka | 94.4 /100 | #89 | Exceptional 11.5% |
| Aleuts | 94.1 /100 | #90 | Exceptional 11.5% |
| Immigrants | Germany | 94.1 /100 | #91 | Exceptional 11.5% |
| Kenyans | 93.9 /100 | #92 | Exceptional 11.5% |
| Immigrants | Poland | 92.9 /100 | #93 | Exceptional 11.6% |
| Creek | 92.7 /100 | #94 | Exceptional 11.6% |
| Immigrants | Bosnia and Herzegovina | 92.6 /100 | #95 | Exceptional 11.6% |
| Immigrants | Sweden | 92.6 /100 | #96 | Exceptional 11.6% |
| Romanians | 92.3 /100 | #97 | Exceptional 11.6% |
| Immigrants | Japan | 91.9 /100 | #98 | Exceptional 11.6% |
| Immigrants | Ethiopia | 91.7 /100 | #99 | Exceptional 11.6% |
| Syrians | 91.1 /100 | #100 | Exceptional 11.6% |
| Jordanians | 90.8 /100 | #101 | Exceptional 11.6% |
Demographics Similar to Immigrants from Belize by Seniors Poverty Over the Age of 75
In terms of seniors poverty over the age of 75, the demographic groups most similar to Immigrants from Belize are Immigrants from the Azores (15.2%, a difference of 0.020%), Paiute (15.2%, a difference of 0.030%), Colville (15.2%, a difference of 0.22%), Jamaican (15.1%, a difference of 0.26%), and Apache (15.3%, a difference of 0.61%).
| Demographics | Rating | Rank | Seniors Poverty Over the Age of 75 |
| Immigrants | Senegal | 0.0 /100 | #282 | Tragic 14.8% |
| Guatemalans | 0.0 /100 | #283 | Tragic 14.8% |
| Cheyenne | 0.0 /100 | #284 | Tragic 14.9% |
| Immigrants | Mexico | 0.0 /100 | #285 | Tragic 14.9% |
| Immigrants | Central America | 0.0 /100 | #286 | Tragic 15.0% |
| Immigrants | Guatemala | 0.0 /100 | #287 | Tragic 15.1% |
| Jamaicans | 0.0 /100 | #288 | Tragic 15.1% |
| Immigrants | Belize | 0.0 /100 | #289 | Tragic 15.2% |
| Immigrants | Azores | 0.0 /100 | #290 | Tragic 15.2% |
| Paiute | 0.0 /100 | #291 | Tragic 15.2% |
| Colville | 0.0 /100 | #292 | Tragic 15.2% |
| Apache | 0.0 /100 | #293 | Tragic 15.3% |
| Immigrants | Jamaica | 0.0 /100 | #294 | Tragic 15.3% |
| U.S. Virgin Islanders | 0.0 /100 | #295 | Tragic 15.4% |
| Yuman | 0.0 /100 | #296 | Tragic 15.4% |