Okinawan vs U.S. Virgin Islander Seniors Poverty Over the Age of 75
COMPARE
Okinawan
U.S. Virgin Islander
Seniors Poverty Over the Age of 75
Seniors Poverty Over the Age of 75 Comparison
Okinawans
U.S. Virgin Islanders
12.1%
SENIORS POVERTY OVER THE AGE OF 75
56.3/ 100
METRIC RATING
165th/ 347
METRIC RANK
15.4%
SENIORS POVERTY OVER THE AGE OF 75
0.0/ 100
METRIC RATING
295th/ 347
METRIC RANK
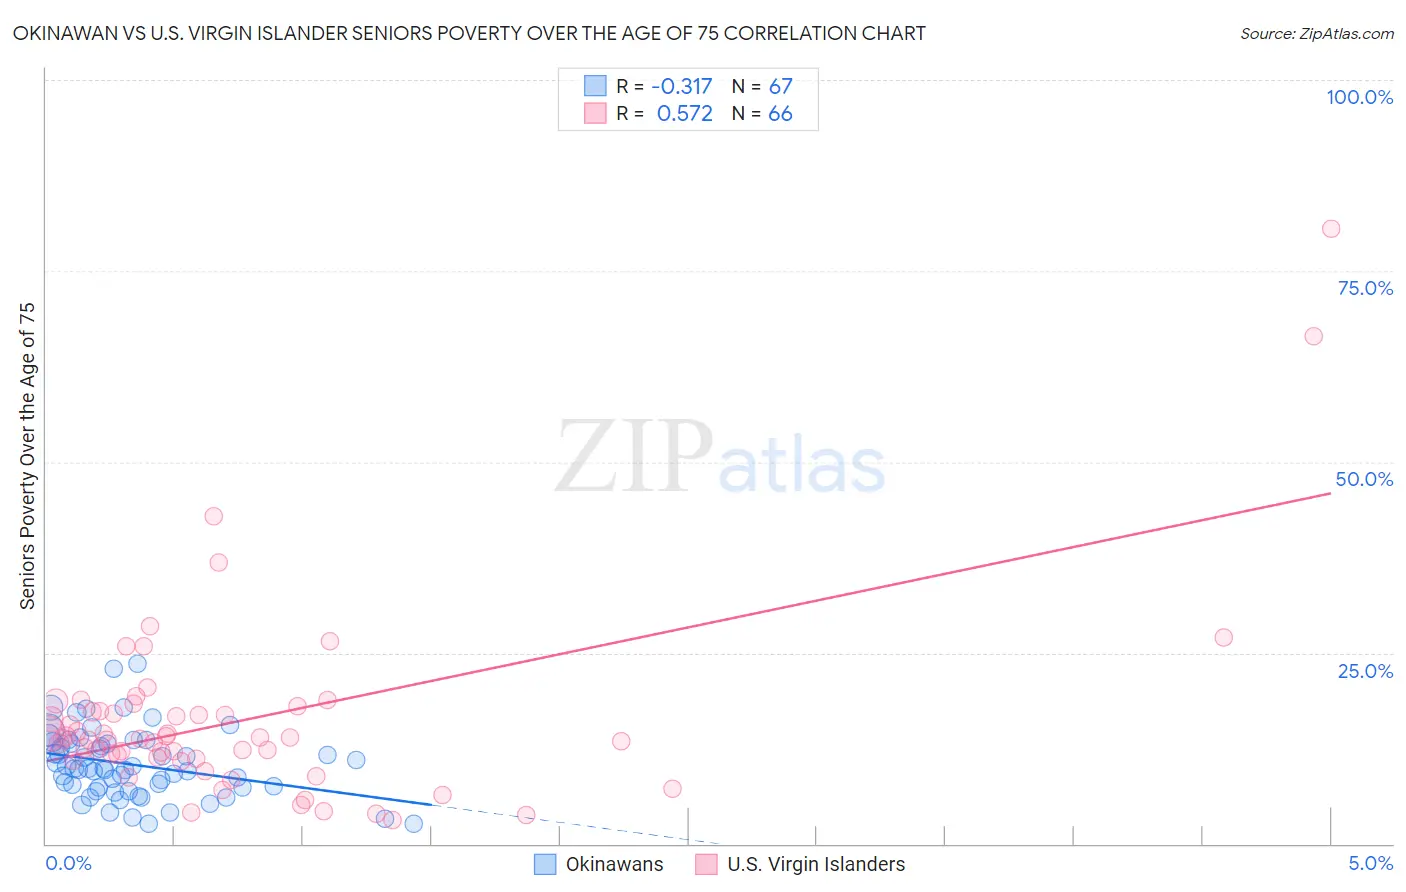
Okinawan vs U.S. Virgin Islander Seniors Poverty Over the Age of 75 Correlation Chart
The statistical analysis conducted on geographies consisting of 73,553,307 people shows a mild negative correlation between the proportion of Okinawans and poverty level among seniors over the age of 75 in the United States with a correlation coefficient (R) of -0.317 and weighted average of 12.1%. Similarly, the statistical analysis conducted on geographies consisting of 87,346,721 people shows a substantial positive correlation between the proportion of U.S. Virgin Islanders and poverty level among seniors over the age of 75 in the United States with a correlation coefficient (R) of 0.572 and weighted average of 15.4%, a difference of 26.8%.
Seniors Poverty Over the Age of 75 Correlation Summary
| Measurement | Okinawan | U.S. Virgin Islander |
| Minimum | 2.6% | 3.0% |
| Maximum | 23.6% | 80.5% |
| Range | 21.1% | 77.5% |
| Mean | 10.4% | 16.3% |
| Median | 9.8% | 13.8% |
| Interquartile 25% (IQ1) | 7.3% | 11.2% |
| Interquartile 75% (IQ3) | 13.1% | 17.3% |
| Interquartile Range (IQR) | 5.8% | 6.1% |
| Standard Deviation (Sample) | 4.5% | 12.6% |
| Standard Deviation (Population) | 4.4% | 12.5% |
Similar Demographics by Seniors Poverty Over the Age of 75
Demographics Similar to Okinawans by Seniors Poverty Over the Age of 75
In terms of seniors poverty over the age of 75, the demographic groups most similar to Okinawans are Potawatomi (12.1%, a difference of 0.090%), Egyptian (12.1%, a difference of 0.12%), Immigrants from Switzerland (12.1%, a difference of 0.14%), Immigrants from Greece (12.1%, a difference of 0.16%), and Immigrants from Syria (12.2%, a difference of 0.20%).
| Demographics | Rating | Rank | Seniors Poverty Over the Age of 75 |
| Portuguese | 61.3 /100 | #158 | Good 12.1% |
| Immigrants | Middle Africa | 61.2 /100 | #159 | Good 12.1% |
| Immigrants | Eastern Africa | 60.9 /100 | #160 | Good 12.1% |
| Immigrants | Norway | 60.6 /100 | #161 | Good 12.1% |
| Immigrants | Serbia | 60.2 /100 | #162 | Good 12.1% |
| Immigrants | Greece | 58.2 /100 | #163 | Average 12.1% |
| Potawatomi | 57.4 /100 | #164 | Average 12.1% |
| Okinawans | 56.3 /100 | #165 | Average 12.1% |
| Egyptians | 54.8 /100 | #166 | Average 12.1% |
| Immigrants | Switzerland | 54.5 /100 | #167 | Average 12.1% |
| Immigrants | Syria | 53.9 /100 | #168 | Average 12.2% |
| Immigrants | Egypt | 53.7 /100 | #169 | Average 12.2% |
| Immigrants | Thailand | 52.0 /100 | #170 | Average 12.2% |
| Spaniards | 51.6 /100 | #171 | Average 12.2% |
| Immigrants | Fiji | 51.5 /100 | #172 | Average 12.2% |
Demographics Similar to U.S. Virgin Islanders by Seniors Poverty Over the Age of 75
In terms of seniors poverty over the age of 75, the demographic groups most similar to U.S. Virgin Islanders are Yuman (15.4%, a difference of 0.18%), Immigrants from Jamaica (15.3%, a difference of 0.19%), Honduran (15.4%, a difference of 0.46%), Apache (15.3%, a difference of 0.64%), and Native/Alaskan (15.5%, a difference of 0.80%).
| Demographics | Rating | Rank | Seniors Poverty Over the Age of 75 |
| Jamaicans | 0.0 /100 | #288 | Tragic 15.1% |
| Immigrants | Belize | 0.0 /100 | #289 | Tragic 15.2% |
| Immigrants | Azores | 0.0 /100 | #290 | Tragic 15.2% |
| Paiute | 0.0 /100 | #291 | Tragic 15.2% |
| Colville | 0.0 /100 | #292 | Tragic 15.2% |
| Apache | 0.0 /100 | #293 | Tragic 15.3% |
| Immigrants | Jamaica | 0.0 /100 | #294 | Tragic 15.3% |
| U.S. Virgin Islanders | 0.0 /100 | #295 | Tragic 15.4% |
| Yuman | 0.0 /100 | #296 | Tragic 15.4% |
| Hondurans | 0.0 /100 | #297 | Tragic 15.4% |
| Natives/Alaskans | 0.0 /100 | #298 | Tragic 15.5% |
| Spanish American Indians | 0.0 /100 | #299 | Tragic 15.5% |
| Bahamians | 0.0 /100 | #300 | Tragic 15.5% |
| Immigrants | Latin America | 0.0 /100 | #301 | Tragic 15.6% |
| West Indians | 0.0 /100 | #302 | Tragic 15.7% |