Costa Rican vs Canadian Child Poverty Under the Age of 16
COMPARE
Costa Rican
Canadian
Child Poverty Under the Age of 16
Child Poverty Under the Age of 16 Comparison
Costa Ricans
Canadians
16.0%
CHILD POVERTY UNDER THE AGE OF 16
61.1/ 100
METRIC RATING
167th/ 347
METRIC RANK
15.2%
CHILD POVERTY UNDER THE AGE OF 16
89.1/ 100
METRIC RATING
132nd/ 347
METRIC RANK
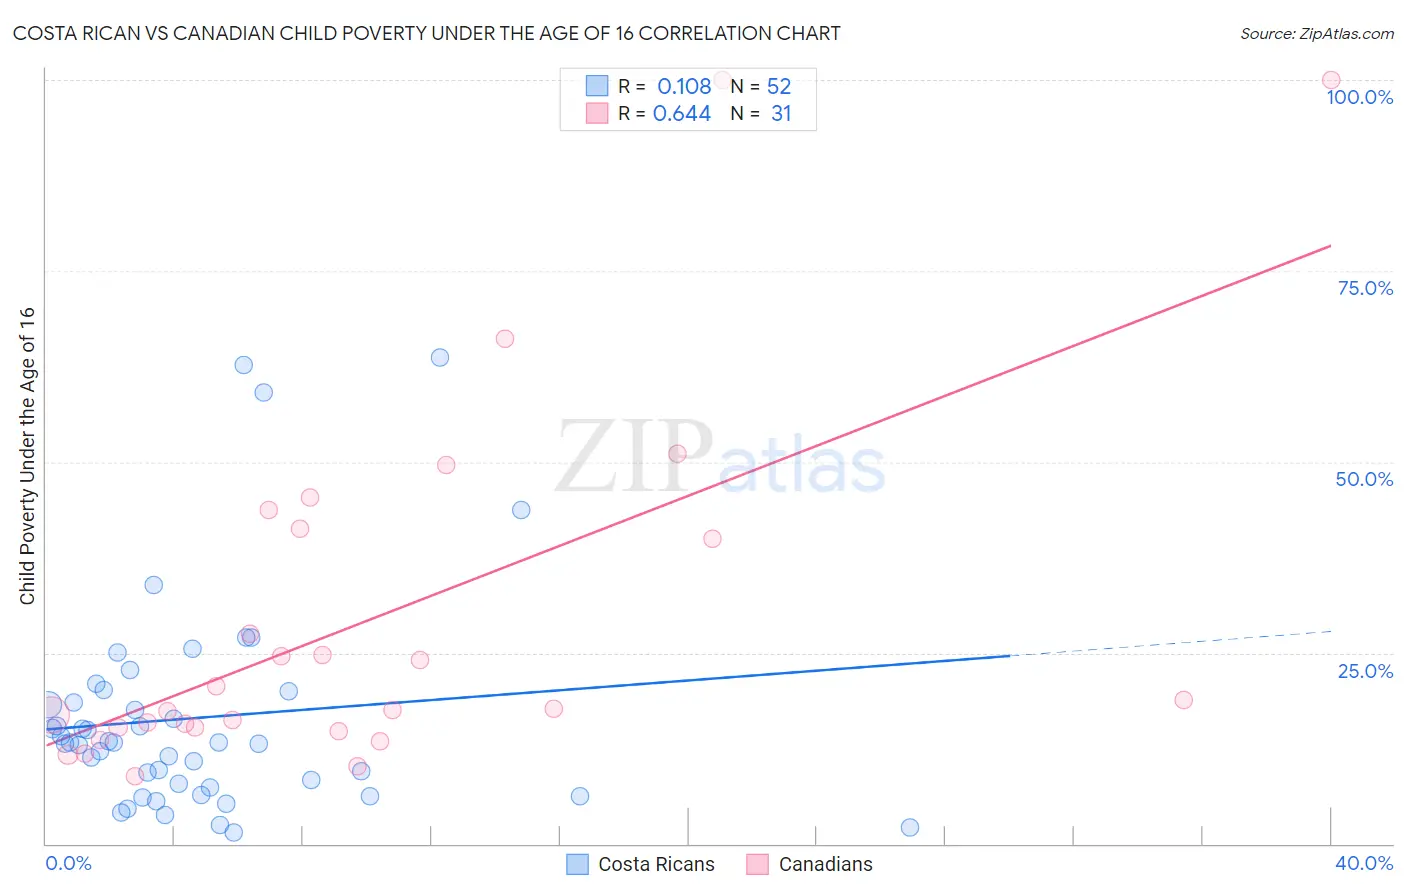
Costa Rican vs Canadian Child Poverty Under the Age of 16 Correlation Chart
The statistical analysis conducted on geographies consisting of 252,372,287 people shows a poor positive correlation between the proportion of Costa Ricans and poverty level among children under the age of 16 in the United States with a correlation coefficient (R) of 0.108 and weighted average of 16.0%. Similarly, the statistical analysis conducted on geographies consisting of 431,912,296 people shows a significant positive correlation between the proportion of Canadians and poverty level among children under the age of 16 in the United States with a correlation coefficient (R) of 0.644 and weighted average of 15.2%, a difference of 5.3%.
Child Poverty Under the Age of 16 Correlation Summary
| Measurement | Costa Rican | Canadian |
| Minimum | 1.5% | 8.9% |
| Maximum | 63.6% | 100.0% |
| Range | 62.2% | 91.1% |
| Mean | 16.5% | 29.3% |
| Median | 13.3% | 17.7% |
| Interquartile 25% (IQ1) | 7.7% | 15.2% |
| Interquartile 75% (IQ3) | 19.2% | 41.2% |
| Interquartile Range (IQR) | 11.6% | 26.0% |
| Standard Deviation (Sample) | 14.0% | 23.7% |
| Standard Deviation (Population) | 13.9% | 23.3% |
Similar Demographics by Child Poverty Under the Age of 16
Demographics Similar to Costa Ricans by Child Poverty Under the Age of 16
In terms of child poverty under the age of 16, the demographic groups most similar to Costa Ricans are South American (16.0%, a difference of 0.40%), Immigrants from Oceania (15.9%, a difference of 0.57%), Guamanian/Chamorro (15.9%, a difference of 0.70%), Uruguayan (16.1%, a difference of 0.80%), and Immigrants from Germany (15.8%, a difference of 0.84%).
| Demographics | Rating | Rank | Child Poverty Under the Age of 16 |
| Immigrants | Albania | 70.7 /100 | #160 | Good 15.8% |
| Immigrants | Northern Africa | 68.1 /100 | #161 | Good 15.8% |
| Colombians | 67.6 /100 | #162 | Good 15.8% |
| Yugoslavians | 67.6 /100 | #163 | Good 15.8% |
| Immigrants | Germany | 67.3 /100 | #164 | Good 15.8% |
| Guamanians/Chamorros | 66.4 /100 | #165 | Good 15.9% |
| Immigrants | Oceania | 65.4 /100 | #166 | Good 15.9% |
| Costa Ricans | 61.1 /100 | #167 | Good 16.0% |
| South Americans | 57.9 /100 | #168 | Average 16.0% |
| Uruguayans | 54.7 /100 | #169 | Average 16.1% |
| Immigrants | Colombia | 54.4 /100 | #170 | Average 16.1% |
| Hungarians | 52.5 /100 | #171 | Average 16.2% |
| Afghans | 52.3 /100 | #172 | Average 16.2% |
| Immigrants | Saudi Arabia | 52.1 /100 | #173 | Average 16.2% |
| Whites/Caucasians | 50.0 /100 | #174 | Average 16.2% |
Demographics Similar to Canadians by Child Poverty Under the Age of 16
In terms of child poverty under the age of 16, the demographic groups most similar to Canadians are Immigrants from South Eastern Asia (15.2%, a difference of 0.050%), Armenian (15.2%, a difference of 0.090%), Mongolian (15.2%, a difference of 0.12%), Native Hawaiian (15.2%, a difference of 0.14%), and Albanian (15.2%, a difference of 0.18%).
| Demographics | Rating | Rank | Child Poverty Under the Age of 16 |
| Palestinians | 90.9 /100 | #125 | Exceptional 15.1% |
| Portuguese | 90.6 /100 | #126 | Exceptional 15.1% |
| Immigrants | Western Europe | 90.3 /100 | #127 | Exceptional 15.1% |
| Immigrants | Kazakhstan | 90.2 /100 | #128 | Exceptional 15.1% |
| Immigrants | Southern Europe | 89.7 /100 | #129 | Excellent 15.1% |
| Mongolians | 89.5 /100 | #130 | Excellent 15.2% |
| Armenians | 89.4 /100 | #131 | Excellent 15.2% |
| Canadians | 89.1 /100 | #132 | Excellent 15.2% |
| Immigrants | South Eastern Asia | 89.0 /100 | #133 | Excellent 15.2% |
| Native Hawaiians | 88.7 /100 | #134 | Excellent 15.2% |
| Albanians | 88.6 /100 | #135 | Excellent 15.2% |
| Immigrants | Spain | 87.3 /100 | #136 | Excellent 15.3% |
| Peruvians | 87.2 /100 | #137 | Excellent 15.3% |
| Welsh | 87.2 /100 | #138 | Excellent 15.3% |
| Immigrants | Vietnam | 87.1 /100 | #139 | Excellent 15.3% |