Costa Rican vs Immigrants from Kenya Child Poverty Under the Age of 16
COMPARE
Costa Rican
Immigrants from Kenya
Child Poverty Under the Age of 16
Child Poverty Under the Age of 16 Comparison
Costa Ricans
Immigrants from Kenya
16.0%
CHILD POVERTY UNDER THE AGE OF 16
61.1/ 100
METRIC RATING
167th/ 347
METRIC RANK
16.9%
CHILD POVERTY UNDER THE AGE OF 16
19.1/ 100
METRIC RATING
197th/ 347
METRIC RANK
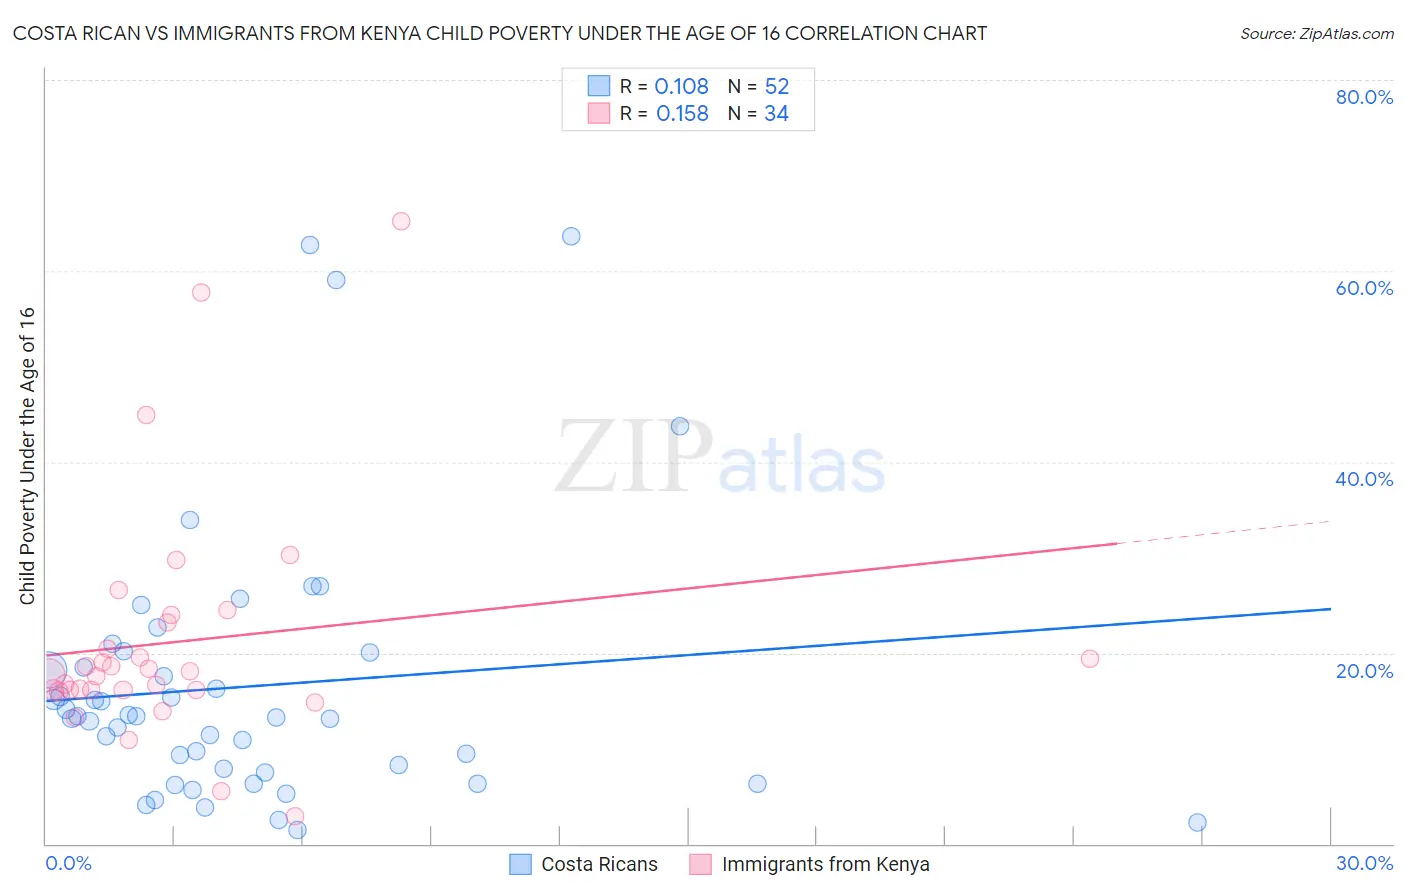
Costa Rican vs Immigrants from Kenya Child Poverty Under the Age of 16 Correlation Chart
The statistical analysis conducted on geographies consisting of 252,372,287 people shows a poor positive correlation between the proportion of Costa Ricans and poverty level among children under the age of 16 in the United States with a correlation coefficient (R) of 0.108 and weighted average of 16.0%. Similarly, the statistical analysis conducted on geographies consisting of 217,344,865 people shows a poor positive correlation between the proportion of Immigrants from Kenya and poverty level among children under the age of 16 in the United States with a correlation coefficient (R) of 0.158 and weighted average of 16.9%, a difference of 5.8%.
Child Poverty Under the Age of 16 Correlation Summary
| Measurement | Costa Rican | Immigrants from Kenya |
| Minimum | 1.5% | 2.8% |
| Maximum | 63.6% | 65.2% |
| Range | 62.2% | 62.4% |
| Mean | 16.5% | 21.2% |
| Median | 13.3% | 17.9% |
| Interquartile 25% (IQ1) | 7.7% | 16.1% |
| Interquartile 75% (IQ3) | 19.2% | 23.1% |
| Interquartile Range (IQR) | 11.6% | 7.1% |
| Standard Deviation (Sample) | 14.0% | 12.5% |
| Standard Deviation (Population) | 13.9% | 12.3% |
Similar Demographics by Child Poverty Under the Age of 16
Demographics Similar to Costa Ricans by Child Poverty Under the Age of 16
In terms of child poverty under the age of 16, the demographic groups most similar to Costa Ricans are South American (16.0%, a difference of 0.40%), Immigrants from Oceania (15.9%, a difference of 0.57%), Guamanian/Chamorro (15.9%, a difference of 0.70%), Uruguayan (16.1%, a difference of 0.80%), and Immigrants from Germany (15.8%, a difference of 0.84%).
| Demographics | Rating | Rank | Child Poverty Under the Age of 16 |
| Immigrants | Albania | 70.7 /100 | #160 | Good 15.8% |
| Immigrants | Northern Africa | 68.1 /100 | #161 | Good 15.8% |
| Colombians | 67.6 /100 | #162 | Good 15.8% |
| Yugoslavians | 67.6 /100 | #163 | Good 15.8% |
| Immigrants | Germany | 67.3 /100 | #164 | Good 15.8% |
| Guamanians/Chamorros | 66.4 /100 | #165 | Good 15.9% |
| Immigrants | Oceania | 65.4 /100 | #166 | Good 15.9% |
| Costa Ricans | 61.1 /100 | #167 | Good 16.0% |
| South Americans | 57.9 /100 | #168 | Average 16.0% |
| Uruguayans | 54.7 /100 | #169 | Average 16.1% |
| Immigrants | Colombia | 54.4 /100 | #170 | Average 16.1% |
| Hungarians | 52.5 /100 | #171 | Average 16.2% |
| Afghans | 52.3 /100 | #172 | Average 16.2% |
| Immigrants | Saudi Arabia | 52.1 /100 | #173 | Average 16.2% |
| Whites/Caucasians | 50.0 /100 | #174 | Average 16.2% |
Demographics Similar to Immigrants from Kenya by Child Poverty Under the Age of 16
In terms of child poverty under the age of 16, the demographic groups most similar to Immigrants from Kenya are Delaware (17.0%, a difference of 0.40%), Immigrants from Lebanon (16.8%, a difference of 0.52%), Immigrants from Uganda (16.8%, a difference of 0.60%), Immigrants from Uruguay (16.8%, a difference of 0.69%), and Spaniard (16.8%, a difference of 0.71%).
| Demographics | Rating | Rank | Child Poverty Under the Age of 16 |
| Immigrants | Costa Rica | 29.6 /100 | #190 | Fair 16.6% |
| Immigrants | Iraq | 28.3 /100 | #191 | Fair 16.7% |
| Spanish | 24.5 /100 | #192 | Fair 16.7% |
| Spaniards | 23.2 /100 | #193 | Fair 16.8% |
| Immigrants | Uruguay | 23.1 /100 | #194 | Fair 16.8% |
| Immigrants | Uganda | 22.5 /100 | #195 | Fair 16.8% |
| Immigrants | Lebanon | 22.0 /100 | #196 | Fair 16.8% |
| Immigrants | Kenya | 19.1 /100 | #197 | Poor 16.9% |
| Delaware | 17.1 /100 | #198 | Poor 17.0% |
| Immigrants | Afghanistan | 15.1 /100 | #199 | Poor 17.0% |
| Immigrants | Cameroon | 14.7 /100 | #200 | Poor 17.1% |
| Immigrants | Uzbekistan | 14.7 /100 | #201 | Poor 17.1% |
| Ugandans | 14.3 /100 | #202 | Poor 17.1% |
| Immigrants | Sierra Leone | 14.2 /100 | #203 | Poor 17.1% |
| Hmong | 14.0 /100 | #204 | Poor 17.1% |