Costa Rican vs Bulgarian Family Poverty
COMPARE
Costa Rican
Bulgarian
Family Poverty
Family Poverty Comparison
Costa Ricans
Bulgarians
9.0%
FAMILY POVERTY
49.3/ 100
METRIC RATING
175th/ 347
METRIC RANK
7.1%
FAMILY POVERTY
99.8/ 100
METRIC RATING
10th/ 347
METRIC RANK
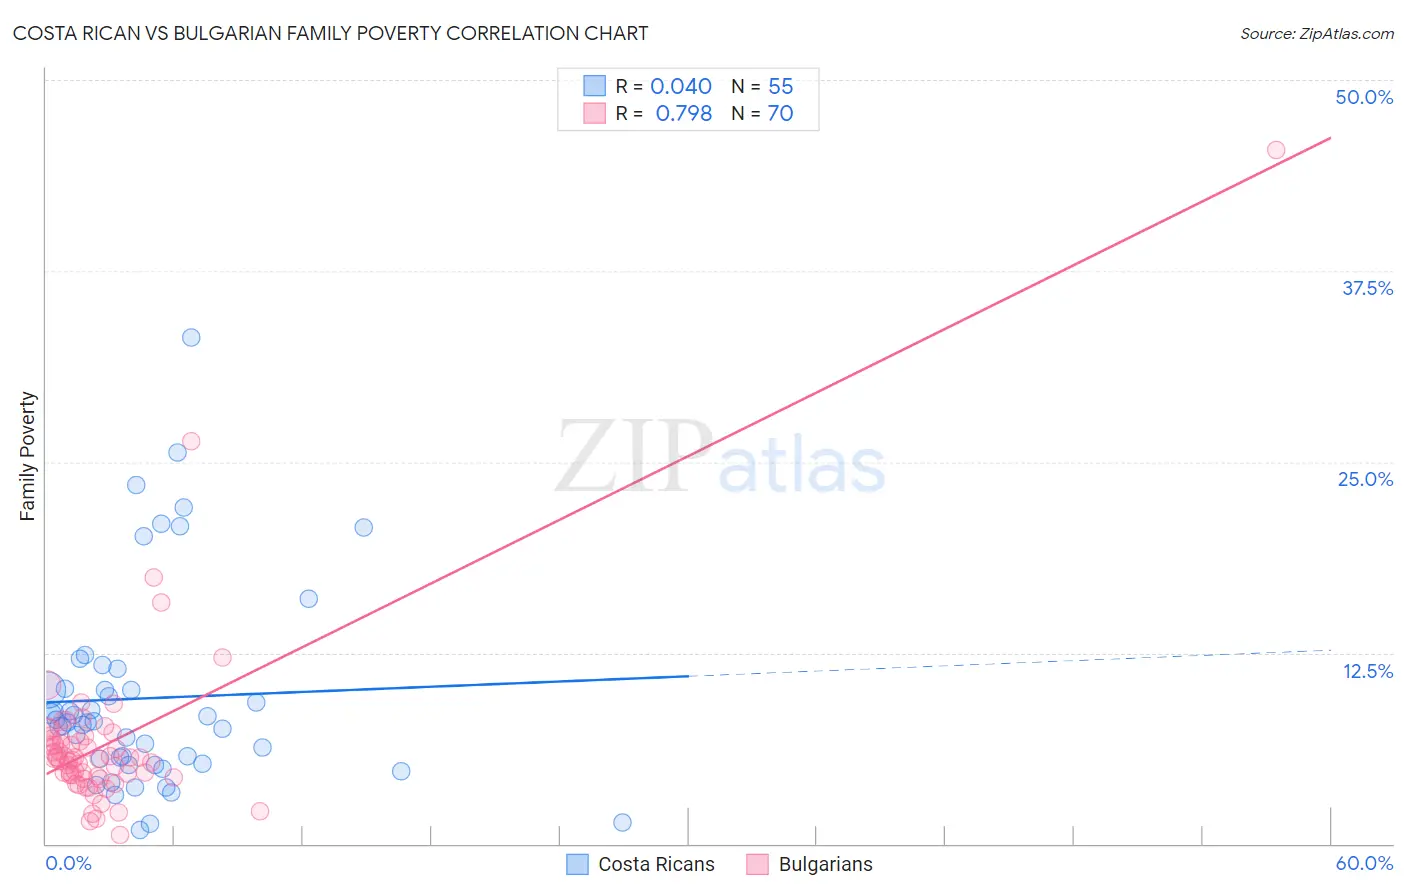
Costa Rican vs Bulgarian Family Poverty Correlation Chart
The statistical analysis conducted on geographies consisting of 253,260,366 people shows no correlation between the proportion of Costa Ricans and poverty level among families in the United States with a correlation coefficient (R) of 0.040 and weighted average of 9.0%. Similarly, the statistical analysis conducted on geographies consisting of 205,316,077 people shows a strong positive correlation between the proportion of Bulgarians and poverty level among families in the United States with a correlation coefficient (R) of 0.798 and weighted average of 7.1%, a difference of 27.0%.
Family Poverty Correlation Summary
| Measurement | Costa Rican | Bulgarian |
| Minimum | 0.94% | 0.55% |
| Maximum | 33.1% | 45.5% |
| Range | 32.2% | 44.9% |
| Mean | 9.5% | 6.7% |
| Median | 8.0% | 5.6% |
| Interquartile 25% (IQ1) | 5.2% | 4.4% |
| Interquartile 75% (IQ3) | 10.1% | 6.9% |
| Interquartile Range (IQR) | 4.9% | 2.5% |
| Standard Deviation (Sample) | 6.6% | 6.0% |
| Standard Deviation (Population) | 6.6% | 5.9% |
Similar Demographics by Family Poverty
Demographics Similar to Costa Ricans by Family Poverty
In terms of family poverty, the demographic groups most similar to Costa Ricans are Immigrants from Albania (9.0%, a difference of 0.090%), Immigrants from Syria (9.0%, a difference of 0.24%), Hawaiian (9.0%, a difference of 0.27%), Immigrants from Cameroon (9.0%, a difference of 0.28%), and Immigrants from Iraq (9.1%, a difference of 0.65%).
| Demographics | Rating | Rank | Family Poverty |
| Israelis | 62.1 /100 | #168 | Good 8.9% |
| Immigrants | Chile | 59.6 /100 | #169 | Average 8.9% |
| Kenyans | 58.2 /100 | #170 | Average 8.9% |
| Lebanese | 57.6 /100 | #171 | Average 8.9% |
| Immigrants | Peru | 57.5 /100 | #172 | Average 8.9% |
| Immigrants | Fiji | 56.4 /100 | #173 | Average 8.9% |
| Immigrants | Albania | 50.0 /100 | #174 | Average 9.0% |
| Costa Ricans | 49.3 /100 | #175 | Average 9.0% |
| Immigrants | Syria | 47.5 /100 | #176 | Average 9.0% |
| Hawaiians | 47.2 /100 | #177 | Average 9.0% |
| Immigrants | Cameroon | 47.1 /100 | #178 | Average 9.0% |
| Immigrants | Iraq | 44.4 /100 | #179 | Average 9.1% |
| Immigrants | Uganda | 43.4 /100 | #180 | Average 9.1% |
| Hmong | 40.2 /100 | #181 | Average 9.1% |
| Immigrants | Morocco | 40.2 /100 | #182 | Average 9.1% |
Demographics Similar to Bulgarians by Family Poverty
In terms of family poverty, the demographic groups most similar to Bulgarians are Immigrants from Singapore (7.1%, a difference of 0.010%), Latvian (7.1%, a difference of 0.25%), Maltese (7.1%, a difference of 0.30%), Swedish (7.1%, a difference of 0.35%), and Iranian (7.1%, a difference of 0.36%).
| Demographics | Rating | Rank | Family Poverty |
| Immigrants | Taiwan | 100.0 /100 | #3 | Exceptional 6.6% |
| Filipinos | 100.0 /100 | #4 | Exceptional 6.6% |
| Thais | 100.0 /100 | #5 | Exceptional 6.7% |
| Norwegians | 99.9 /100 | #6 | Exceptional 6.9% |
| Immigrants | Ireland | 99.9 /100 | #7 | Exceptional 7.0% |
| Bhutanese | 99.9 /100 | #8 | Exceptional 7.0% |
| Latvians | 99.9 /100 | #9 | Exceptional 7.1% |
| Bulgarians | 99.8 /100 | #10 | Exceptional 7.1% |
| Immigrants | Singapore | 99.8 /100 | #11 | Exceptional 7.1% |
| Maltese | 99.8 /100 | #12 | Exceptional 7.1% |
| Swedes | 99.8 /100 | #13 | Exceptional 7.1% |
| Iranians | 99.8 /100 | #14 | Exceptional 7.1% |
| Lithuanians | 99.8 /100 | #15 | Exceptional 7.2% |
| Immigrants | South Central Asia | 99.8 /100 | #16 | Exceptional 7.2% |
| Luxembourgers | 99.8 /100 | #17 | Exceptional 7.2% |