American vs Bulgarian Family Poverty
COMPARE
American
Bulgarian
Family Poverty
Family Poverty Comparison
Americans
Bulgarians
9.8%
FAMILY POVERTY
6.2/ 100
METRIC RATING
217th/ 347
METRIC RANK
7.1%
FAMILY POVERTY
99.8/ 100
METRIC RATING
10th/ 347
METRIC RANK
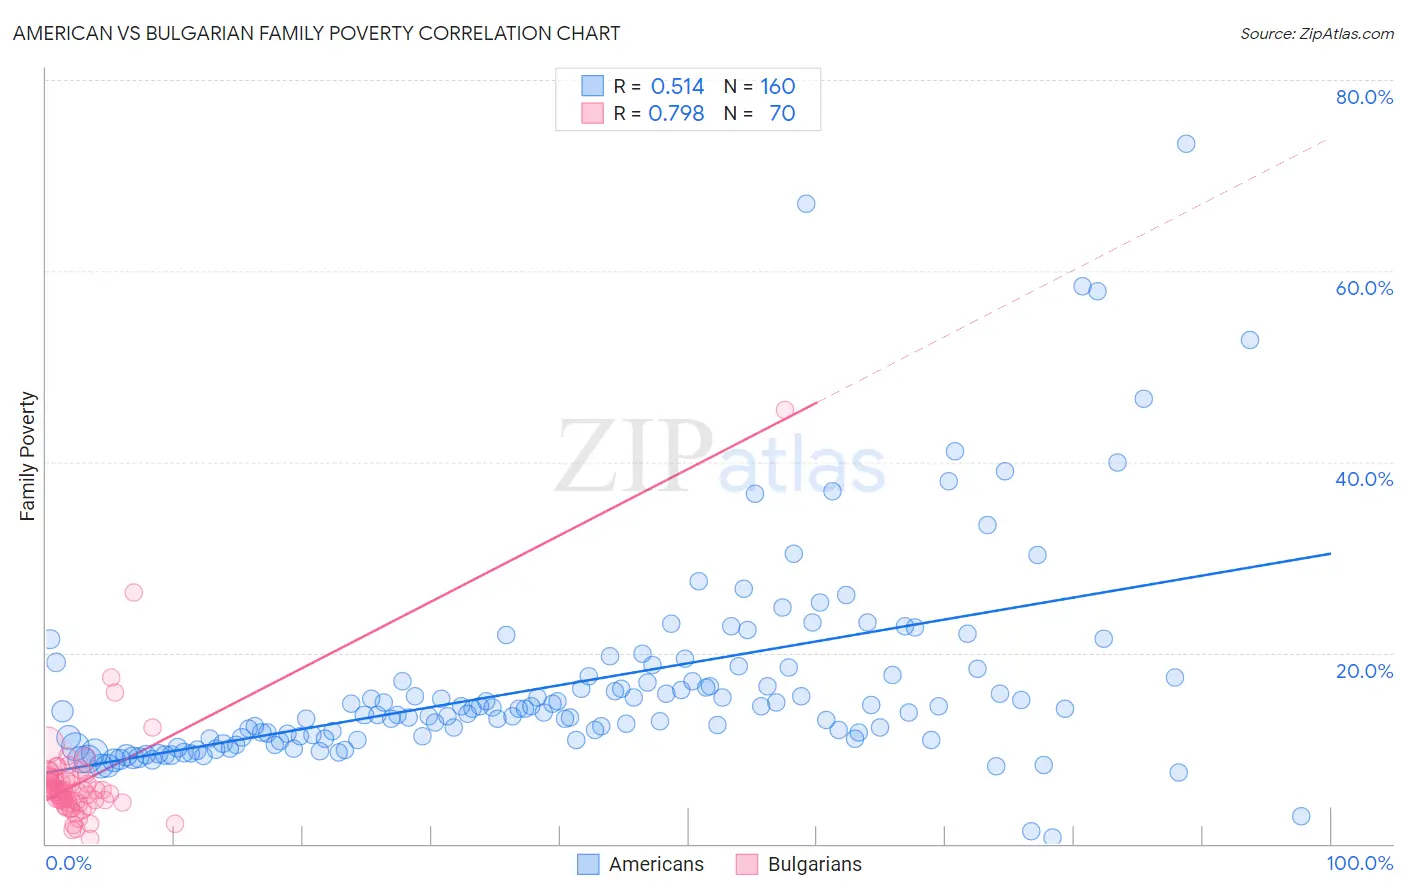
American vs Bulgarian Family Poverty Correlation Chart
The statistical analysis conducted on geographies consisting of 576,491,417 people shows a substantial positive correlation between the proportion of Americans and poverty level among families in the United States with a correlation coefficient (R) of 0.514 and weighted average of 9.8%. Similarly, the statistical analysis conducted on geographies consisting of 205,316,077 people shows a strong positive correlation between the proportion of Bulgarians and poverty level among families in the United States with a correlation coefficient (R) of 0.798 and weighted average of 7.1%, a difference of 38.2%.
Family Poverty Correlation Summary
| Measurement | American | Bulgarian |
| Minimum | 0.65% | 0.55% |
| Maximum | 73.3% | 45.5% |
| Range | 72.7% | 44.9% |
| Mean | 16.8% | 6.7% |
| Median | 13.8% | 5.6% |
| Interquartile 25% (IQ1) | 11.0% | 4.4% |
| Interquartile 75% (IQ3) | 17.6% | 6.9% |
| Interquartile Range (IQR) | 6.6% | 2.5% |
| Standard Deviation (Sample) | 11.0% | 6.0% |
| Standard Deviation (Population) | 11.0% | 5.9% |
Similar Demographics by Family Poverty
Demographics Similar to Americans by Family Poverty
In terms of family poverty, the demographic groups most similar to Americans are Moroccan (9.8%, a difference of 0.20%), Nonimmigrants (9.8%, a difference of 0.26%), Immigrants from Micronesia (9.8%, a difference of 0.29%), Panamanian (9.8%, a difference of 0.32%), and Immigrants from Eritrea (9.9%, a difference of 0.44%).
| Demographics | Rating | Rank | Family Poverty |
| Alsatians | 11.3 /100 | #210 | Poor 9.6% |
| Malaysians | 10.6 /100 | #211 | Poor 9.6% |
| Immigrants | Thailand | 9.7 /100 | #212 | Tragic 9.7% |
| Osage | 8.0 /100 | #213 | Tragic 9.7% |
| Immigrants | Micronesia | 6.7 /100 | #214 | Tragic 9.8% |
| Immigrants | Nonimmigrants | 6.7 /100 | #215 | Tragic 9.8% |
| Moroccans | 6.5 /100 | #216 | Tragic 9.8% |
| Americans | 6.2 /100 | #217 | Tragic 9.8% |
| Panamanians | 5.6 /100 | #218 | Tragic 9.8% |
| Immigrants | Eritrea | 5.4 /100 | #219 | Tragic 9.9% |
| Bermudans | 5.3 /100 | #220 | Tragic 9.9% |
| Immigrants | Cambodia | 4.8 /100 | #221 | Tragic 9.9% |
| Japanese | 4.8 /100 | #222 | Tragic 9.9% |
| Immigrants | Africa | 4.3 /100 | #223 | Tragic 9.9% |
| Marshallese | 3.9 /100 | #224 | Tragic 9.9% |
Demographics Similar to Bulgarians by Family Poverty
In terms of family poverty, the demographic groups most similar to Bulgarians are Immigrants from Singapore (7.1%, a difference of 0.010%), Latvian (7.1%, a difference of 0.25%), Maltese (7.1%, a difference of 0.30%), Swedish (7.1%, a difference of 0.35%), and Iranian (7.1%, a difference of 0.36%).
| Demographics | Rating | Rank | Family Poverty |
| Immigrants | Taiwan | 100.0 /100 | #3 | Exceptional 6.6% |
| Filipinos | 100.0 /100 | #4 | Exceptional 6.6% |
| Thais | 100.0 /100 | #5 | Exceptional 6.7% |
| Norwegians | 99.9 /100 | #6 | Exceptional 6.9% |
| Immigrants | Ireland | 99.9 /100 | #7 | Exceptional 7.0% |
| Bhutanese | 99.9 /100 | #8 | Exceptional 7.0% |
| Latvians | 99.9 /100 | #9 | Exceptional 7.1% |
| Bulgarians | 99.8 /100 | #10 | Exceptional 7.1% |
| Immigrants | Singapore | 99.8 /100 | #11 | Exceptional 7.1% |
| Maltese | 99.8 /100 | #12 | Exceptional 7.1% |
| Swedes | 99.8 /100 | #13 | Exceptional 7.1% |
| Iranians | 99.8 /100 | #14 | Exceptional 7.1% |
| Lithuanians | 99.8 /100 | #15 | Exceptional 7.2% |
| Immigrants | South Central Asia | 99.8 /100 | #16 | Exceptional 7.2% |
| Luxembourgers | 99.8 /100 | #17 | Exceptional 7.2% |