Colville vs White/Caucasian Seniors Poverty Over the Age of 65
COMPARE
Colville
White/Caucasian
Seniors Poverty Over the Age of 65
Seniors Poverty Over the Age of 65 Comparison
Colville
Whites/Caucasians
13.5%
SENIORS POVERTY OVER THE AGE OF 65
0.0/ 100
METRIC RATING
284th/ 347
METRIC RANK
10.0%
SENIORS POVERTY OVER THE AGE OF 65
97.5/ 100
METRIC RATING
78th/ 347
METRIC RANK
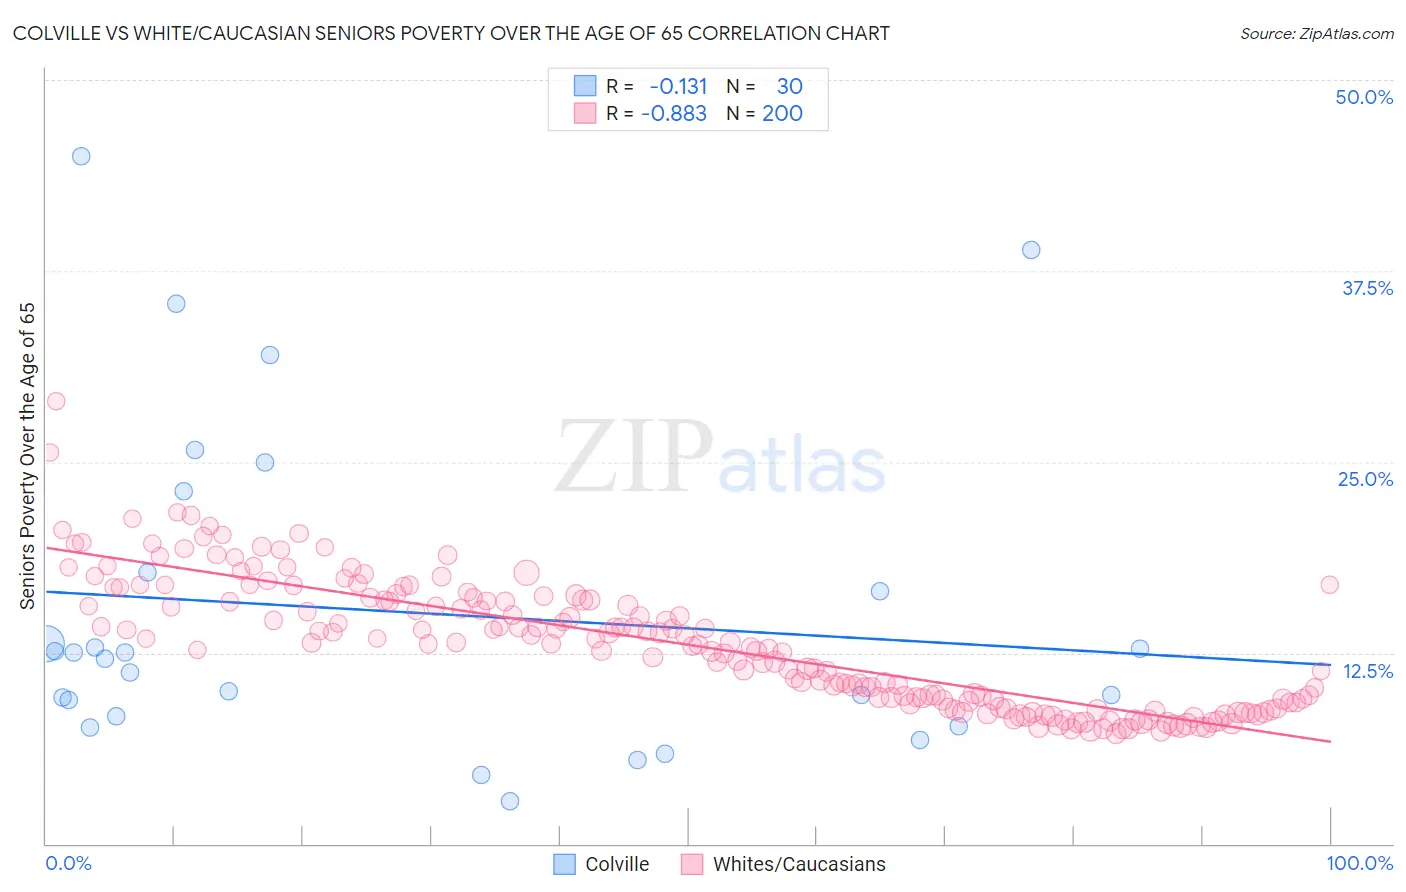
Colville vs White/Caucasian Seniors Poverty Over the Age of 65 Correlation Chart
The statistical analysis conducted on geographies consisting of 34,619,145 people shows a poor negative correlation between the proportion of Colville and poverty level among seniors over the age of 65 in the United States with a correlation coefficient (R) of -0.131 and weighted average of 13.5%. Similarly, the statistical analysis conducted on geographies consisting of 577,696,181 people shows a very strong negative correlation between the proportion of Whites/Caucasians and poverty level among seniors over the age of 65 in the United States with a correlation coefficient (R) of -0.883 and weighted average of 10.0%, a difference of 34.4%.
Seniors Poverty Over the Age of 65 Correlation Summary
| Measurement | Colville | White/Caucasian |
| Minimum | 2.8% | 7.2% |
| Maximum | 45.0% | 29.0% |
| Range | 42.2% | 21.8% |
| Mean | 15.2% | 13.0% |
| Median | 12.3% | 13.1% |
| Interquartile 25% (IQ1) | 8.3% | 9.2% |
| Interquartile 75% (IQ3) | 17.8% | 15.9% |
| Interquartile Range (IQR) | 9.5% | 6.7% |
| Standard Deviation (Sample) | 10.7% | 4.2% |
| Standard Deviation (Population) | 10.5% | 4.2% |
Similar Demographics by Seniors Poverty Over the Age of 65
Demographics Similar to Colville by Seniors Poverty Over the Age of 65
In terms of seniors poverty over the age of 65, the demographic groups most similar to Colville are Guatemalan (13.5%, a difference of 0.23%), Immigrants from Senegal (13.6%, a difference of 0.50%), Immigrants from Mexico (13.6%, a difference of 0.63%), Belizean (13.6%, a difference of 0.77%), and Central American (13.4%, a difference of 0.89%).
| Demographics | Rating | Rank | Seniors Poverty Over the Age of 65 |
| Paiute | 0.0 /100 | #277 | Tragic 12.9% |
| Immigrants | Bahamas | 0.0 /100 | #278 | Tragic 13.0% |
| Mexicans | 0.0 /100 | #279 | Tragic 13.1% |
| Yuman | 0.0 /100 | #280 | Tragic 13.1% |
| Immigrants | El Salvador | 0.0 /100 | #281 | Tragic 13.1% |
| Senegalese | 0.0 /100 | #282 | Tragic 13.3% |
| Central Americans | 0.0 /100 | #283 | Tragic 13.4% |
| Colville | 0.0 /100 | #284 | Tragic 13.5% |
| Guatemalans | 0.0 /100 | #285 | Tragic 13.5% |
| Immigrants | Senegal | 0.0 /100 | #286 | Tragic 13.6% |
| Immigrants | Mexico | 0.0 /100 | #287 | Tragic 13.6% |
| Belizeans | 0.0 /100 | #288 | Tragic 13.6% |
| Jamaicans | 0.0 /100 | #289 | Tragic 13.6% |
| Immigrants | Central America | 0.0 /100 | #290 | Tragic 13.6% |
| Blacks/African Americans | 0.0 /100 | #291 | Tragic 13.7% |
Demographics Similar to Whites/Caucasians by Seniors Poverty Over the Age of 65
In terms of seniors poverty over the age of 65, the demographic groups most similar to Whites/Caucasians are Immigrants from Ireland (10.0%, a difference of 0.010%), Korean (10.1%, a difference of 0.11%), Immigrants from Sri Lanka (10.1%, a difference of 0.14%), Immigrants from Bolivia (10.1%, a difference of 0.21%), and Immigrants from South Africa (10.0%, a difference of 0.24%).
| Demographics | Rating | Rank | Seniors Poverty Over the Age of 65 |
| Yugoslavians | 97.9 /100 | #71 | Exceptional 10.0% |
| Palestinians | 97.9 /100 | #72 | Exceptional 10.0% |
| Russians | 97.9 /100 | #73 | Exceptional 10.0% |
| Turks | 97.9 /100 | #74 | Exceptional 10.0% |
| Immigrants | Czechoslovakia | 97.8 /100 | #75 | Exceptional 10.0% |
| New Zealanders | 97.7 /100 | #76 | Exceptional 10.0% |
| Immigrants | South Africa | 97.7 /100 | #77 | Exceptional 10.0% |
| Whites/Caucasians | 97.5 /100 | #78 | Exceptional 10.0% |
| Immigrants | Ireland | 97.5 /100 | #79 | Exceptional 10.0% |
| Koreans | 97.4 /100 | #80 | Exceptional 10.1% |
| Immigrants | Sri Lanka | 97.3 /100 | #81 | Exceptional 10.1% |
| Immigrants | Bolivia | 97.3 /100 | #82 | Exceptional 10.1% |
| Immigrants | Poland | 97.2 /100 | #83 | Exceptional 10.1% |
| Immigrants | Afghanistan | 97.2 /100 | #84 | Exceptional 10.1% |
| Immigrants | Nepal | 97.2 /100 | #85 | Exceptional 10.1% |