Australian vs White/Caucasian Seniors Poverty Over the Age of 65
COMPARE
Australian
White/Caucasian
Seniors Poverty Over the Age of 65
Seniors Poverty Over the Age of 65 Comparison
Australians
Whites/Caucasians
9.9%
SENIORS POVERTY OVER THE AGE OF 65
98.4/ 100
METRIC RATING
69th/ 347
METRIC RANK
10.0%
SENIORS POVERTY OVER THE AGE OF 65
97.5/ 100
METRIC RATING
78th/ 347
METRIC RANK
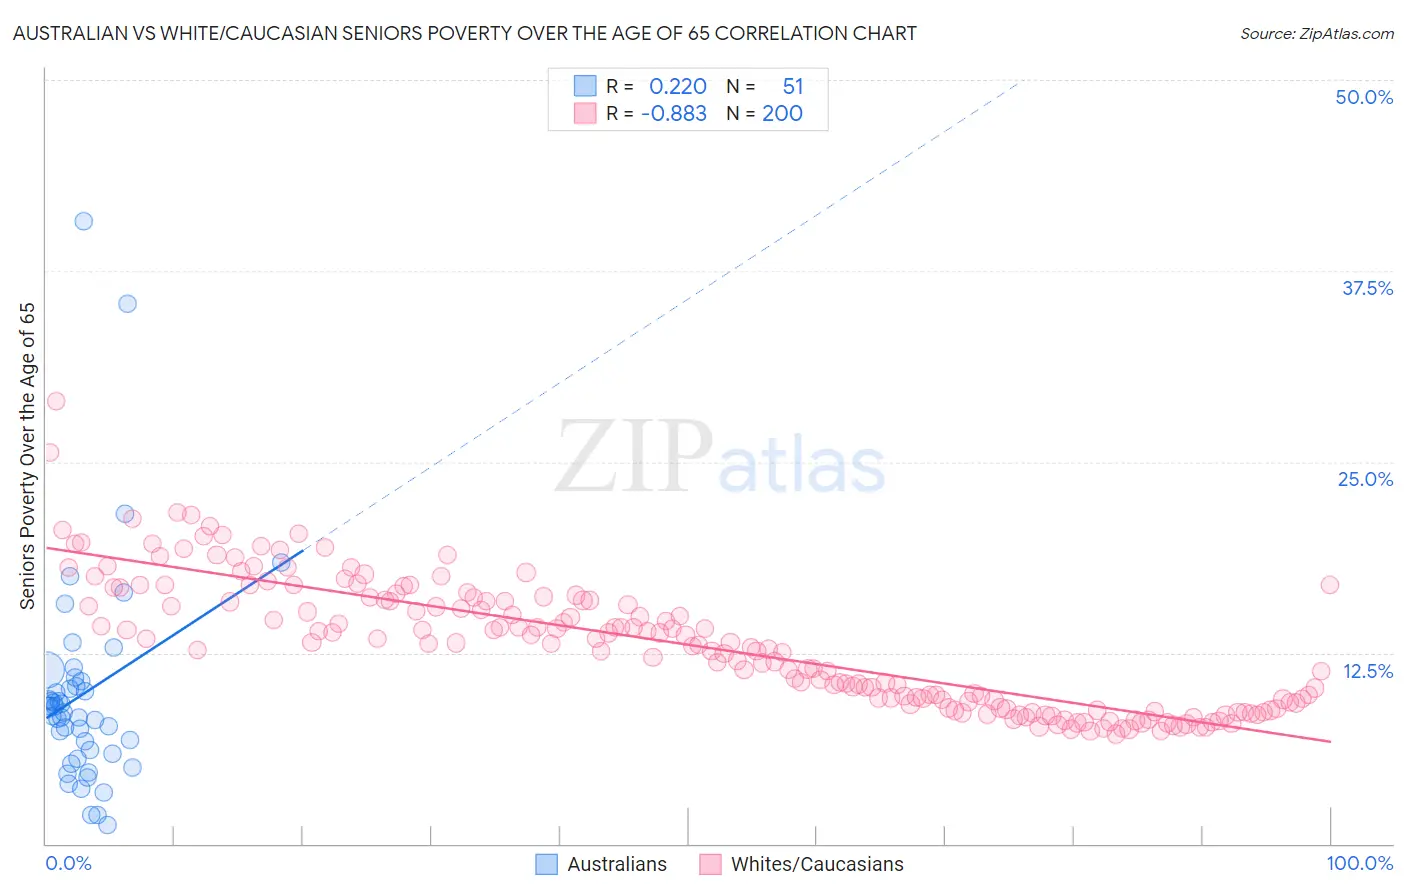
Australian vs White/Caucasian Seniors Poverty Over the Age of 65 Correlation Chart
The statistical analysis conducted on geographies consisting of 223,667,118 people shows a weak positive correlation between the proportion of Australians and poverty level among seniors over the age of 65 in the United States with a correlation coefficient (R) of 0.220 and weighted average of 9.9%. Similarly, the statistical analysis conducted on geographies consisting of 577,696,181 people shows a very strong negative correlation between the proportion of Whites/Caucasians and poverty level among seniors over the age of 65 in the United States with a correlation coefficient (R) of -0.883 and weighted average of 10.0%, a difference of 1.1%.
Seniors Poverty Over the Age of 65 Correlation Summary
| Measurement | Australian | White/Caucasian |
| Minimum | 1.2% | 7.2% |
| Maximum | 40.8% | 29.0% |
| Range | 39.6% | 21.8% |
| Mean | 9.8% | 13.0% |
| Median | 8.6% | 13.1% |
| Interquartile 25% (IQ1) | 5.9% | 9.2% |
| Interquartile 75% (IQ3) | 10.7% | 15.9% |
| Interquartile Range (IQR) | 4.8% | 6.7% |
| Standard Deviation (Sample) | 7.1% | 4.2% |
| Standard Deviation (Population) | 7.1% | 4.2% |
Demographics Similar to Australians and Whites/Caucasians by Seniors Poverty Over the Age of 65
In terms of seniors poverty over the age of 65, the demographic groups most similar to Australians are Canadian (9.9%, a difference of 0.16%), Immigrants from Austria (9.9%, a difference of 0.37%), Immigrants from Netherlands (9.9%, a difference of 0.48%), Pennsylvania German (9.9%, a difference of 0.53%), and Samoan (10.0%, a difference of 0.57%). Similarly, the demographic groups most similar to Whites/Caucasians are Immigrants from Ireland (10.0%, a difference of 0.010%), Korean (10.1%, a difference of 0.11%), Immigrants from Sri Lanka (10.1%, a difference of 0.14%), Immigrants from Bolivia (10.1%, a difference of 0.21%), and Immigrants from South Africa (10.0%, a difference of 0.24%).
| Demographics | Rating | Rank | Seniors Poverty Over the Age of 65 |
| Macedonians | 98.8 /100 | #63 | Exceptional 9.9% |
| Immigrants | North America | 98.8 /100 | #64 | Exceptional 9.9% |
| Pennsylvania Germans | 98.7 /100 | #65 | Exceptional 9.9% |
| Immigrants | Netherlands | 98.7 /100 | #66 | Exceptional 9.9% |
| Immigrants | Austria | 98.6 /100 | #67 | Exceptional 9.9% |
| Canadians | 98.5 /100 | #68 | Exceptional 9.9% |
| Australians | 98.4 /100 | #69 | Exceptional 9.9% |
| Samoans | 98.0 /100 | #70 | Exceptional 10.0% |
| Yugoslavians | 97.9 /100 | #71 | Exceptional 10.0% |
| Palestinians | 97.9 /100 | #72 | Exceptional 10.0% |
| Russians | 97.9 /100 | #73 | Exceptional 10.0% |
| Turks | 97.9 /100 | #74 | Exceptional 10.0% |
| Immigrants | Czechoslovakia | 97.8 /100 | #75 | Exceptional 10.0% |
| New Zealanders | 97.7 /100 | #76 | Exceptional 10.0% |
| Immigrants | South Africa | 97.7 /100 | #77 | Exceptional 10.0% |
| Whites/Caucasians | 97.5 /100 | #78 | Exceptional 10.0% |
| Immigrants | Ireland | 97.5 /100 | #79 | Exceptional 10.0% |
| Koreans | 97.4 /100 | #80 | Exceptional 10.1% |
| Immigrants | Sri Lanka | 97.3 /100 | #81 | Exceptional 10.1% |
| Immigrants | Bolivia | 97.3 /100 | #82 | Exceptional 10.1% |
| Immigrants | Poland | 97.2 /100 | #83 | Exceptional 10.1% |