Immigrants from Israel vs Immigrants from Indonesia Receiving Food Stamps
COMPARE
Immigrants from Israel
Immigrants from Indonesia
Receiving Food Stamps
Receiving Food Stamps Comparison
Immigrants from Israel
Immigrants from Indonesia
10.0%
RECEIVING FOOD STAMPS
98.5/ 100
METRIC RATING
84th/ 347
METRIC RANK
9.8%
RECEIVING FOOD STAMPS
99.0/ 100
METRIC RATING
67th/ 347
METRIC RANK
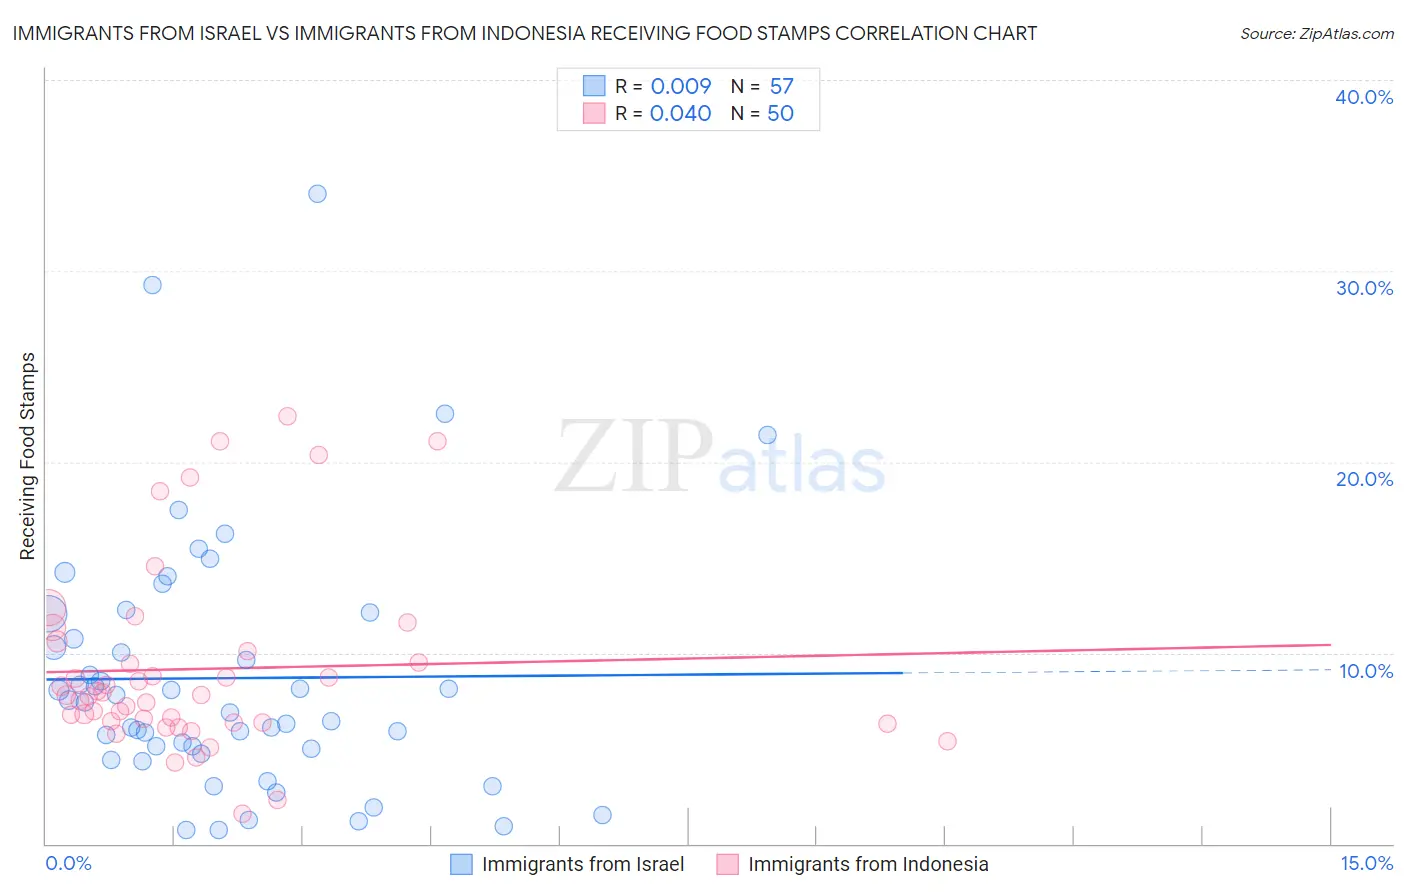
Immigrants from Israel vs Immigrants from Indonesia Receiving Food Stamps Correlation Chart
The statistical analysis conducted on geographies consisting of 209,557,898 people shows no correlation between the proportion of Immigrants from Israel and percentage of population receiving government assistance and/or food stamps in the United States with a correlation coefficient (R) of 0.009 and weighted average of 10.0%. Similarly, the statistical analysis conducted on geographies consisting of 215,507,406 people shows no correlation between the proportion of Immigrants from Indonesia and percentage of population receiving government assistance and/or food stamps in the United States with a correlation coefficient (R) of 0.040 and weighted average of 9.8%, a difference of 1.8%.
Receiving Food Stamps Correlation Summary
| Measurement | Immigrants from Israel | Immigrants from Indonesia |
| Minimum | 0.70% | 1.6% |
| Maximum | 34.0% | 22.4% |
| Range | 33.3% | 20.8% |
| Mean | 8.7% | 9.2% |
| Median | 7.4% | 7.8% |
| Interquartile 25% (IQ1) | 4.9% | 6.4% |
| Interquartile 75% (IQ3) | 11.4% | 10.1% |
| Interquartile Range (IQR) | 6.5% | 3.7% |
| Standard Deviation (Sample) | 6.6% | 4.8% |
| Standard Deviation (Population) | 6.6% | 4.8% |
Demographics Similar to Immigrants from Israel and Immigrants from Indonesia by Receiving Food Stamps
In terms of receiving food stamps, the demographic groups most similar to Immigrants from Israel are Austrian (10.0%, a difference of 0.070%), Dutch (10.0%, a difference of 0.070%), Immigrants from Romania (10.0%, a difference of 0.18%), Immigrants from England (10.0%, a difference of 0.20%), and Polish (10.0%, a difference of 0.34%). Similarly, the demographic groups most similar to Immigrants from Indonesia are Northern European (9.8%, a difference of 0.060%), Slovene (9.8%, a difference of 0.16%), Italian (9.9%, a difference of 0.27%), Immigrants from Serbia (9.9%, a difference of 0.32%), and Immigrants from Turkey (9.8%, a difference of 0.36%).
| Demographics | Rating | Rank | Receiving Food Stamps |
| Immigrants | Turkey | 99.1 /100 | #65 | Exceptional 9.8% |
| Slovenes | 99.1 /100 | #66 | Exceptional 9.8% |
| Immigrants | Indonesia | 99.0 /100 | #67 | Exceptional 9.8% |
| Northern Europeans | 99.0 /100 | #68 | Exceptional 9.8% |
| Italians | 99.0 /100 | #69 | Exceptional 9.9% |
| Immigrants | Serbia | 99.0 /100 | #70 | Exceptional 9.9% |
| Scottish | 98.9 /100 | #71 | Exceptional 9.9% |
| Immigrants | Asia | 98.9 /100 | #72 | Exceptional 9.9% |
| Macedonians | 98.9 /100 | #73 | Exceptional 9.9% |
| New Zealanders | 98.8 /100 | #74 | Exceptional 9.9% |
| Immigrants | Zimbabwe | 98.7 /100 | #75 | Exceptional 9.9% |
| Immigrants | Croatia | 98.7 /100 | #76 | Exceptional 10.0% |
| Immigrants | North Macedonia | 98.7 /100 | #77 | Exceptional 10.0% |
| South Africans | 98.7 /100 | #78 | Exceptional 10.0% |
| Laotians | 98.7 /100 | #79 | Exceptional 10.0% |
| Poles | 98.6 /100 | #80 | Exceptional 10.0% |
| Immigrants | England | 98.6 /100 | #81 | Exceptional 10.0% |
| Austrians | 98.6 /100 | #82 | Exceptional 10.0% |
| Dutch | 98.6 /100 | #83 | Exceptional 10.0% |
| Immigrants | Israel | 98.5 /100 | #84 | Exceptional 10.0% |
| Immigrants | Romania | 98.5 /100 | #85 | Exceptional 10.0% |