Colville vs Immigrants from Indonesia Doctorate Degree
COMPARE
Colville
Immigrants from Indonesia
Doctorate Degree
Doctorate Degree Comparison
Colville
Immigrants from Indonesia
1.6%
DOCTORATE DEGREE
4.7/ 100
METRIC RATING
229th/ 347
METRIC RANK
2.4%
DOCTORATE DEGREE
100.0/ 100
METRIC RATING
54th/ 347
METRIC RANK
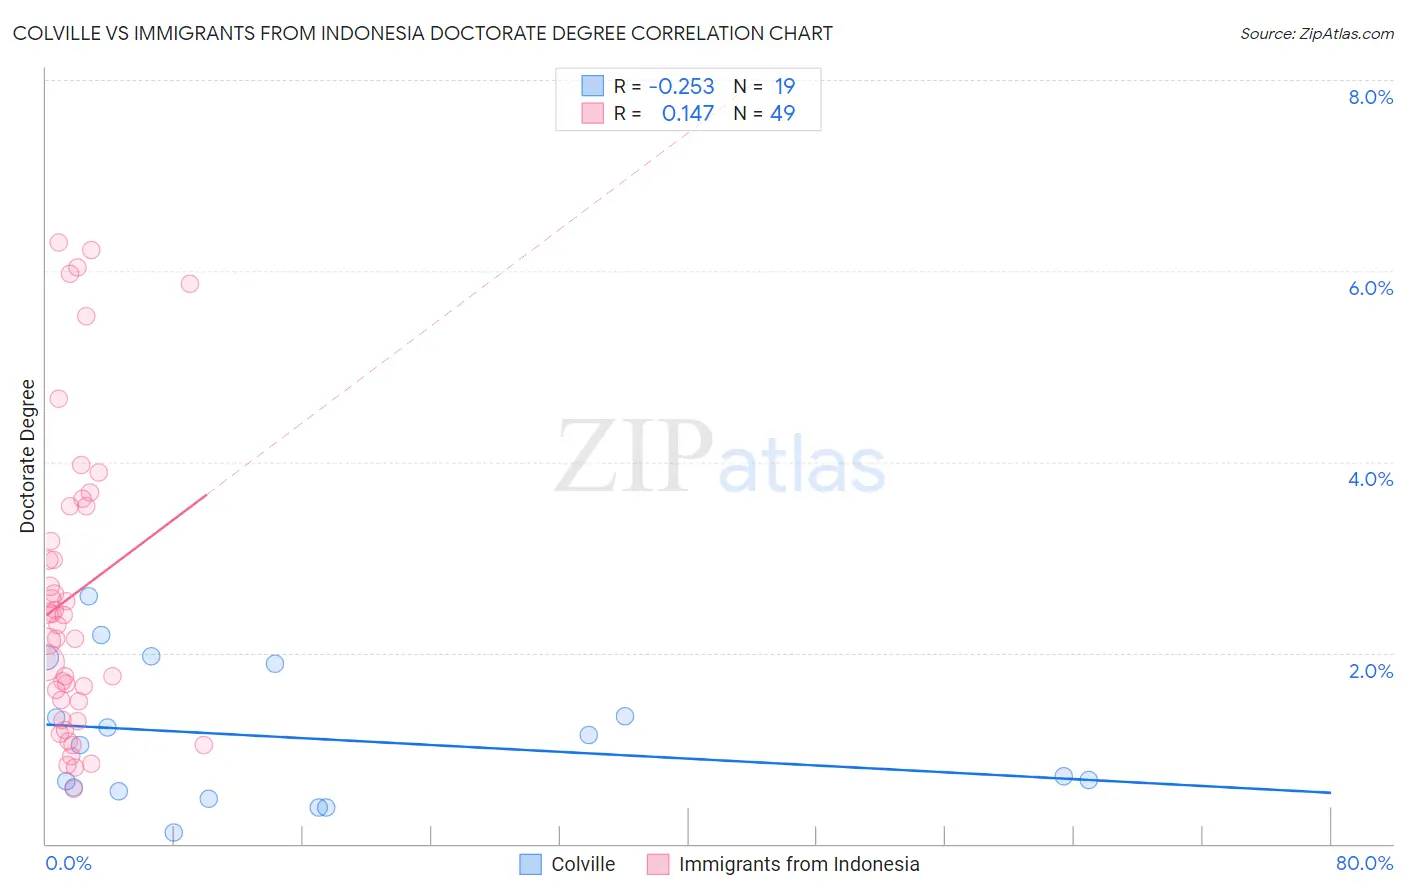
Colville vs Immigrants from Indonesia Doctorate Degree Correlation Chart
The statistical analysis conducted on geographies consisting of 34,569,662 people shows a weak negative correlation between the proportion of Colville and percentage of population with at least doctorate degree education in the United States with a correlation coefficient (R) of -0.253 and weighted average of 1.6%. Similarly, the statistical analysis conducted on geographies consisting of 215,315,104 people shows a poor positive correlation between the proportion of Immigrants from Indonesia and percentage of population with at least doctorate degree education in the United States with a correlation coefficient (R) of 0.147 and weighted average of 2.4%, a difference of 44.7%.
Doctorate Degree Correlation Summary
| Measurement | Colville | Immigrants from Indonesia |
| Minimum | 0.12% | 0.57% |
| Maximum | 2.6% | 6.3% |
| Range | 2.5% | 5.7% |
| Mean | 1.1% | 2.6% |
| Median | 1.0% | 2.3% |
| Interquartile 25% (IQ1) | 0.55% | 1.4% |
| Interquartile 75% (IQ3) | 1.9% | 3.5% |
| Interquartile Range (IQR) | 1.3% | 2.1% |
| Standard Deviation (Sample) | 0.71% | 1.6% |
| Standard Deviation (Population) | 0.69% | 1.6% |
Similar Demographics by Doctorate Degree
Demographics Similar to Colville by Doctorate Degree
In terms of doctorate degree, the demographic groups most similar to Colville are Immigrants from Philippines (1.6%, a difference of 0.31%), Immigrants from North Macedonia (1.6%, a difference of 0.78%), Assyrian/Chaldean/Syriac (1.7%, a difference of 1.0%), Panamanian (1.7%, a difference of 1.3%), and Osage (1.7%, a difference of 1.4%).
| Demographics | Rating | Rank | Doctorate Degree |
| Immigrants | Venezuela | 8.7 /100 | #222 | Tragic 1.7% |
| Immigrants | Bosnia and Herzegovina | 7.8 /100 | #223 | Tragic 1.7% |
| Immigrants | Poland | 7.4 /100 | #224 | Tragic 1.7% |
| Immigrants | Colombia | 6.7 /100 | #225 | Tragic 1.7% |
| Osage | 6.5 /100 | #226 | Tragic 1.7% |
| Panamanians | 6.3 /100 | #227 | Tragic 1.7% |
| Assyrians/Chaldeans/Syriacs | 5.9 /100 | #228 | Tragic 1.7% |
| Colville | 4.7 /100 | #229 | Tragic 1.6% |
| Immigrants | Philippines | 4.3 /100 | #230 | Tragic 1.6% |
| Immigrants | North Macedonia | 3.9 /100 | #231 | Tragic 1.6% |
| Guamanians/Chamorros | 3.3 /100 | #232 | Tragic 1.6% |
| Barbadians | 3.3 /100 | #233 | Tragic 1.6% |
| Hopi | 3.2 /100 | #234 | Tragic 1.6% |
| Cree | 3.0 /100 | #235 | Tragic 1.6% |
| Indonesians | 2.8 /100 | #236 | Tragic 1.6% |
Demographics Similar to Immigrants from Indonesia by Doctorate Degree
In terms of doctorate degree, the demographic groups most similar to Immigrants from Indonesia are Bolivian (2.4%, a difference of 0.080%), Immigrants from Czechoslovakia (2.4%, a difference of 0.17%), Immigrants from Ethiopia (2.4%, a difference of 0.61%), Immigrants from Latvia (2.4%, a difference of 0.68%), and Ethiopian (2.3%, a difference of 0.73%).
| Demographics | Rating | Rank | Doctorate Degree |
| Immigrants | Western Europe | 100.0 /100 | #47 | Exceptional 2.4% |
| Asians | 100.0 /100 | #48 | Exceptional 2.4% |
| Immigrants | Asia | 100.0 /100 | #49 | Exceptional 2.4% |
| Immigrants | Norway | 100.0 /100 | #50 | Exceptional 2.4% |
| Australians | 100.0 /100 | #51 | Exceptional 2.4% |
| Bulgarians | 100.0 /100 | #52 | Exceptional 2.4% |
| Immigrants | Latvia | 100.0 /100 | #53 | Exceptional 2.4% |
| Immigrants | Indonesia | 100.0 /100 | #54 | Exceptional 2.4% |
| Bolivians | 100.0 /100 | #55 | Exceptional 2.4% |
| Immigrants | Czechoslovakia | 100.0 /100 | #56 | Exceptional 2.4% |
| Immigrants | Ethiopia | 100.0 /100 | #57 | Exceptional 2.4% |
| Ethiopians | 99.9 /100 | #58 | Exceptional 2.3% |
| South Africans | 99.9 /100 | #59 | Exceptional 2.3% |
| Immigrants | Serbia | 99.9 /100 | #60 | Exceptional 2.3% |
| Bhutanese | 99.9 /100 | #61 | Exceptional 2.3% |